We take maintenance from reactive to proactive — and downtime from random to predictable.
AWI combines vendor-neutral condition monitoring, intelligent analysis and project engineering to take UK manufacturers from the first warning signal to verified operational improvement.
Monitoring software just finds the fault, then hands it back to you. With AWI our engineers turn up, use the data to find the root cause, and manage projects to engineer it out. We call it closed-loop reliability.
A dashboard alert is where the software market stops and where your problem starts. We analyse the root cause of the failure and manage projects to engineer it out, so the same fault doesn't come back next quarter.
AWI are on site when you need us, not just a remote monitoring desk watching a dashboard. We're engineers too.
A small, nimble UK team of experienced engineers, services built and priced for SMEs.
Manufacturing doesn't clock off at five, and neither does the failure risk. We're built to be there when you're running because that's the only time it matters.
The pattern repeats across UK manufacturing: hours of unplanned downtime each month, an OEE number far below world class, and years of operational data sitting unused. Condition monitoring and predictive maintenance are how that stops being a surprise.
Bearings fail. Lines stop. A single critical asset can wipe out a week's margin in hours. Reactive maintenance is the most expensive way to run a factory — and the default for most UK SMEs.
See what it's costing youMeasured manually, captured late and missing the real loss drivers. OEE.com's published benchmark puts typical discrete manufacturing at 60% against a world-class 85%. The number on the board doesn't match what the team feels on the line.
Illustrative counts for a mid-sized plant. Years of operational data in the CMMS, SCADA, historians and spreadsheets. The insight is in there but nothing extracts it and hiring a data scientist isn't feasible. So nothing changes.
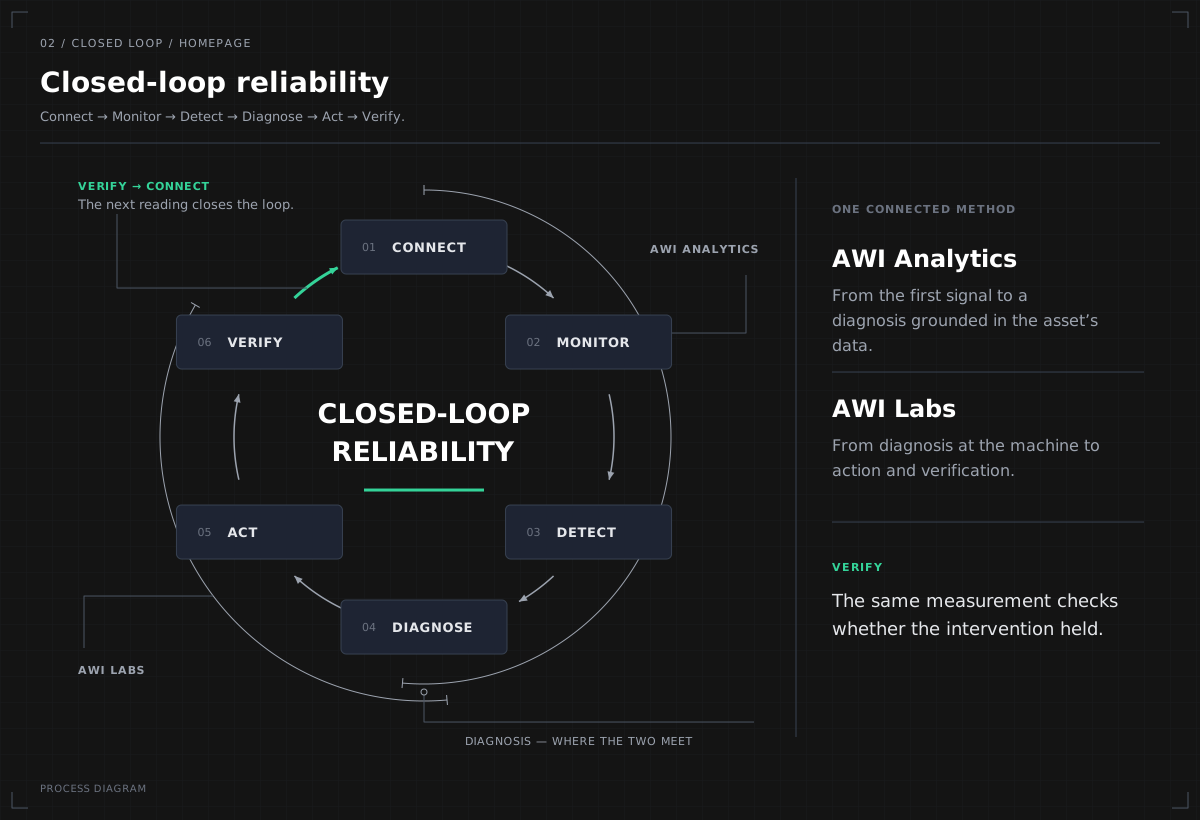
Manufacturing analytics software for UK SME manufacturersCondition monitoring, existing processes and data, joined end to end by project engineering on site. Steps one to four are where AWI Analytics works; steps four to six are where AWI Labs works. Diagnosis is where the two meet.
We integrate with the systems you already run, so there is historical insight from day one. Years of operational data, finally usable.
Inside AWI AnalyticsOn your critical assets we install edge gateway condition monitoring. Right sensors, right placement running live alongside your historical context.
See the live viewAWI Analytics reads live and historical data together and flags the change in behaviour that matters, with the evidence behind it rather than a bare alarm.
How detection worksAn engineer takes the signal apart: what the data shows, what the asset history says and what the machine is doing on the floor. You get a sourced answer, not a guess.
Meet AWI LabsAWI Labs runs projects or just gives useful direction for your team based on what the data is telling us; planned into your schedule rather than forced by a breakdown.
What Labs does on siteWe go back to the same asset and monitor it after the work. If the signature has not changed, the job is not finished and what we learn feeds straight back into step one.
How we close it outEvery monitored asset, diagnosed fault and verified intervention builds a clearer picture of how your operation behaves — making future decisions faster and better informed.
That picture belongs to you. The data is your data and the sensors we specify are not proprietary.
AWI Analytics finds and explains the opportunity. AWI Labs helps engineer the result. Available together as an engineering partnership, or independently when that's a better fit.
Analytics on your live and static data. Ask plain-English questions. Get grounded, sourced answers.
Hands-on engineering services. We specify and install the condition monitoring hardware, integrate the data, and help your team execute on what AWI Analytics surfaces.
Every intervention is written up in the same four stages: what the data showed, what the engineer found on the asset, what we changed, and what the measurements said afterwards.
Documented ranges from mature condition monitoring and predictive analytics programmes. Sources: McKinsey, Deloitte, ARC Advisory, Fluke Corporation. Your numbers will depend on starting point, scope, and execution.
Whatever model you start with, our aim is an ongoing engineering relationship. Each one is designed to step up into a partnership once the work has proved itself on your plant.
A monthly engineering partnership: Analytics access, expanding condition-monitoring coverage, and AWI Labs support across whatever the operation needs.
A fixed-scope engagement to prove value on a specific asset, line, or use case. Defined success metrics and a defined exit point.
Monthly access to AWI Analytics plus the condition-monitoring hardware on your critical assets. Labs available when you need it — not built in by default.
A 30-minute discovery call gives you the answer in real numbers. Run the calculator first if you want to come prepared — or just book the call.