AVAILABLE TO A LIMITED NUMBER OF PILOT PARTNERS

Predictive maintenance and condition monitoring software.

AWI Analytics connects live and historical plant data, detects meaningful change and gives engineers the evidence to diagnose problems, prioritise action and verify the result.

Condition monitoring coupled with process data from the systems you already run, turned into predictive maintenance actions you can plan. Analytics is one half of the loop — AWI Labs engineers the fix and proves it held.

Free 90-day pilot for a small number of partners — book a 30-minute conversation.
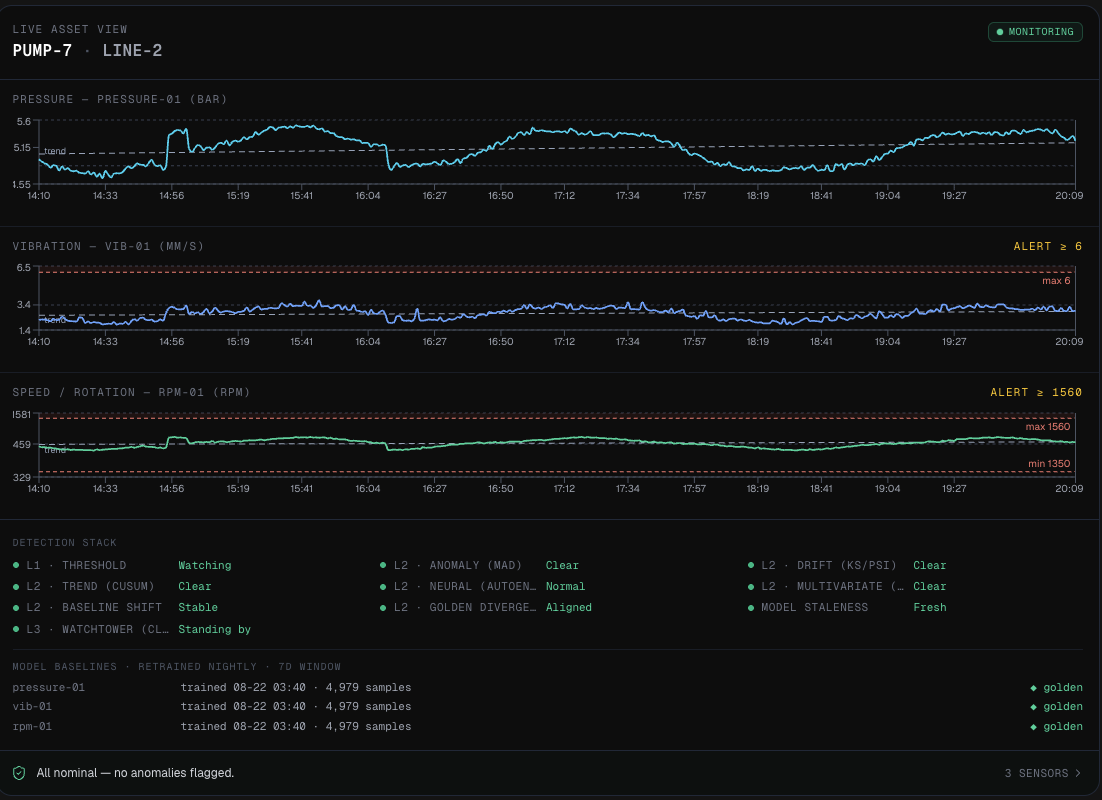
AWI Analytics live asset view — Pump-7 · Line 2: pressure, vibration and RPM trends with detection stack status and model baselines
HOW IT WORKS

How condition monitoring becomes an engineering decision.

Ask “why did pump 1 stop last month?” and get answers from your own data — with an engineering review from us on top. See how AWI Analytics works, step by step.

01

Extract your data

We extract the data from the systems you already run, and integrate your SOPs and operator logs. Historical insight from day one.

CMMS SCADA HISTORIANS SOPS OPERATOR LOGS
02

Monitor where it pays

Right sensors, right placement on your critical assets — live condition data alongside your historical context.

VENDOR-NEUTRAL SPEC ROI-PRIORITISED EDGE GATEWAYS LIVE + HISTORICAL
03

Act on insights

Plain-English answers and proactive alerts. AWI Labs takes on the project engineering when you’d rather not act alone, and the fix is verified against the data that raised it.
SOURCED ANSWERS PROACTIVE ALERTS AWI LABS EXECUTION CLOSED LOOP
INSIDE THE PRODUCT

What the software actually looks like.

EXAMPLE DATA THROUGHOUT
FIVE SCREENS · CHOOSE ONE
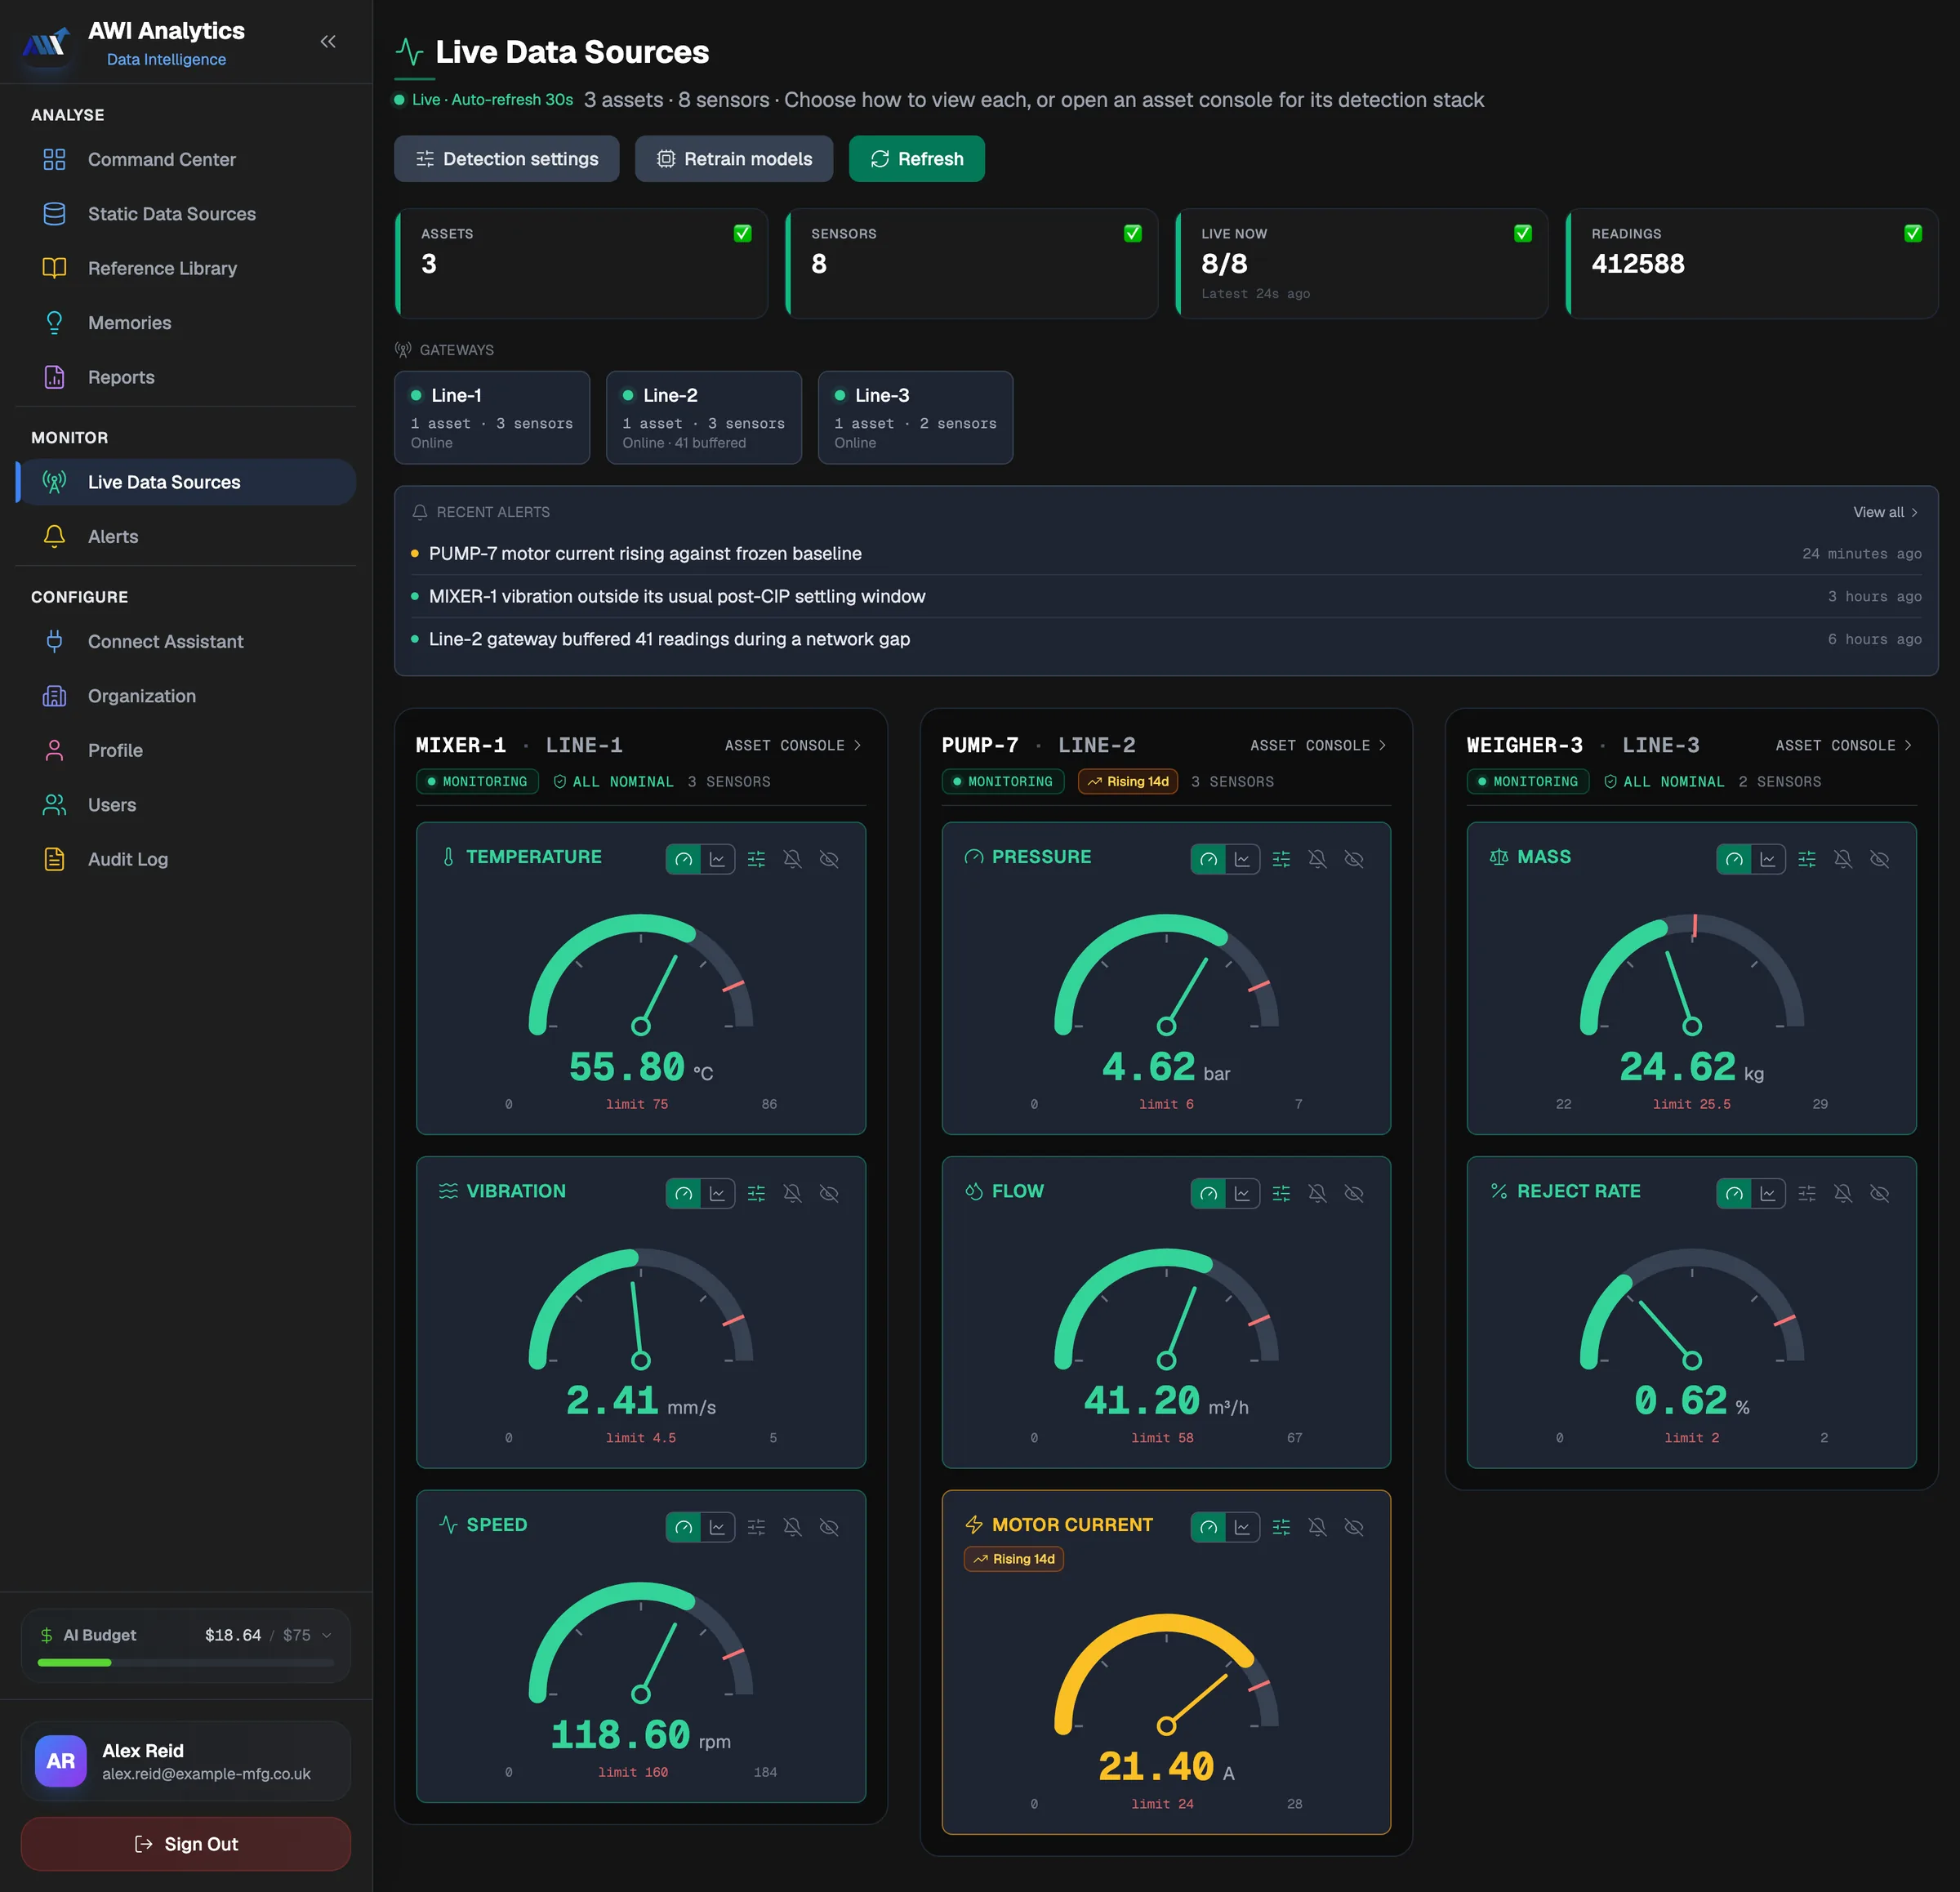
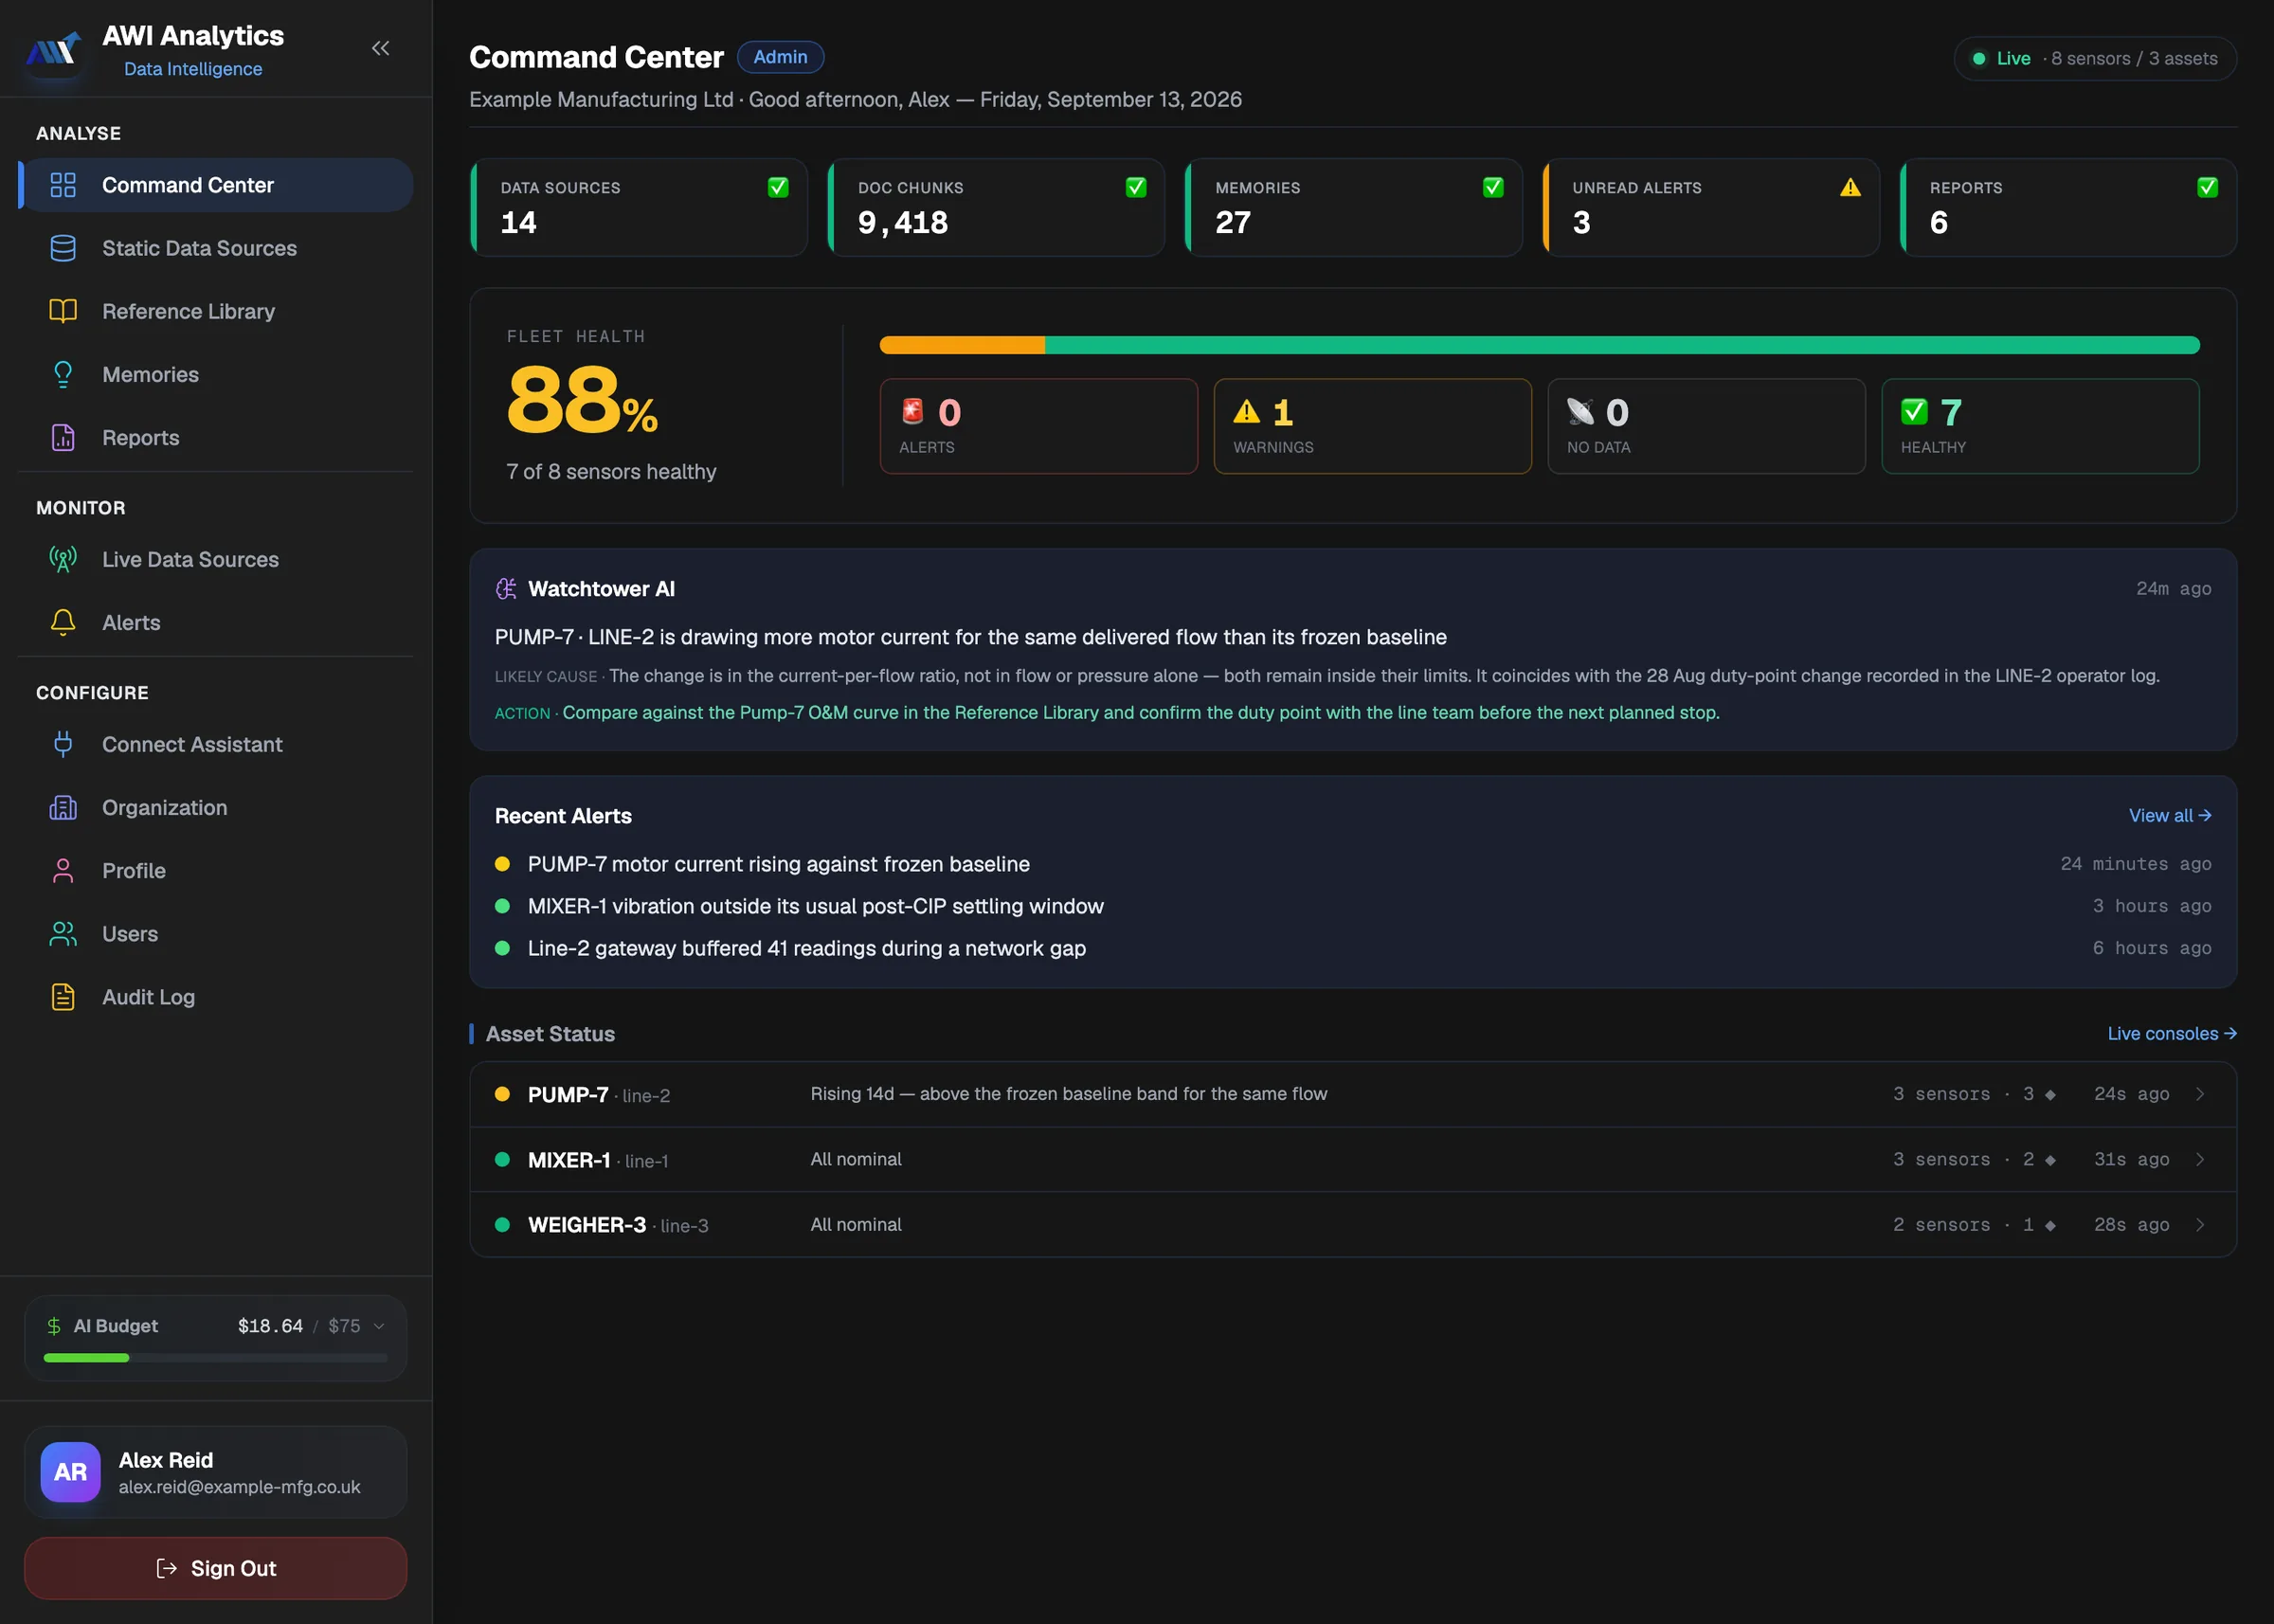
AWI Analytics live asset view — eight sensors across three assets, each dial showing its reading against its own configured limit, with PUMP-7 motor current flagged amber
AWI Analytics Command Center — fleet health 88 per cent, one warning, a Watchtower finding on PUMP-7 and the asset status board
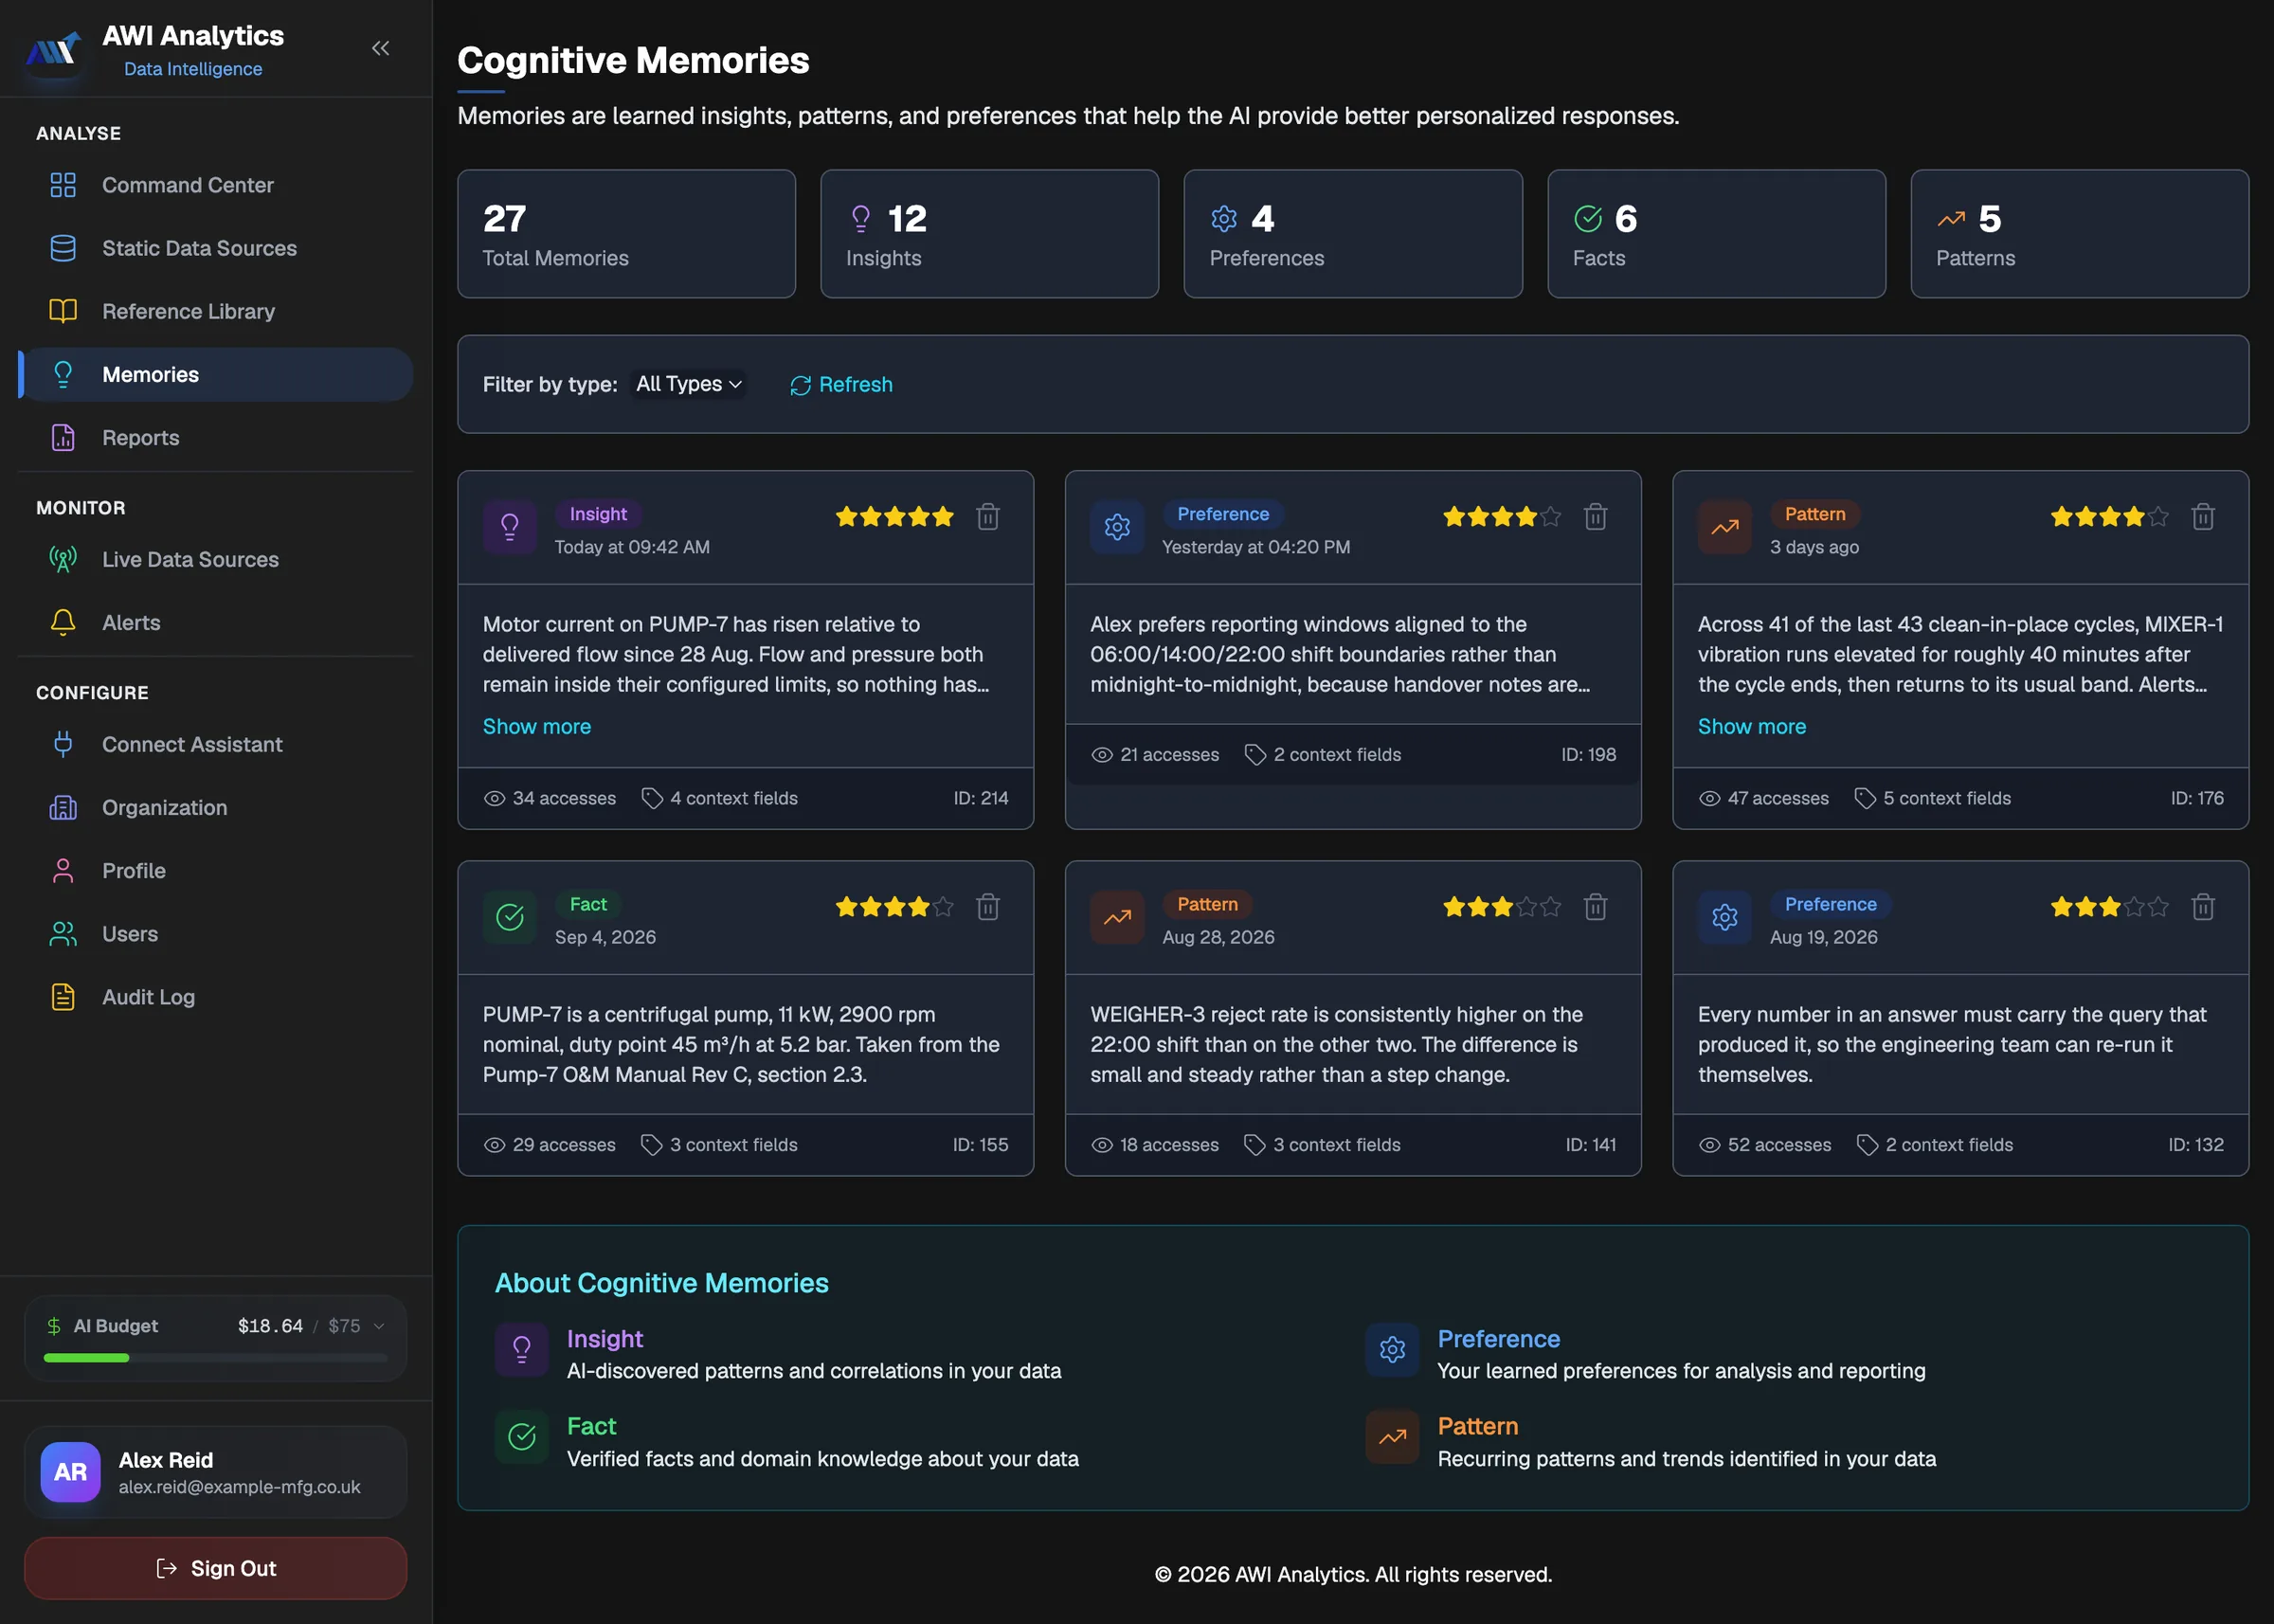
AWI Analytics cognitive memories — 27 stored insights, preferences, facts and patterns about the plant, with importance ratings
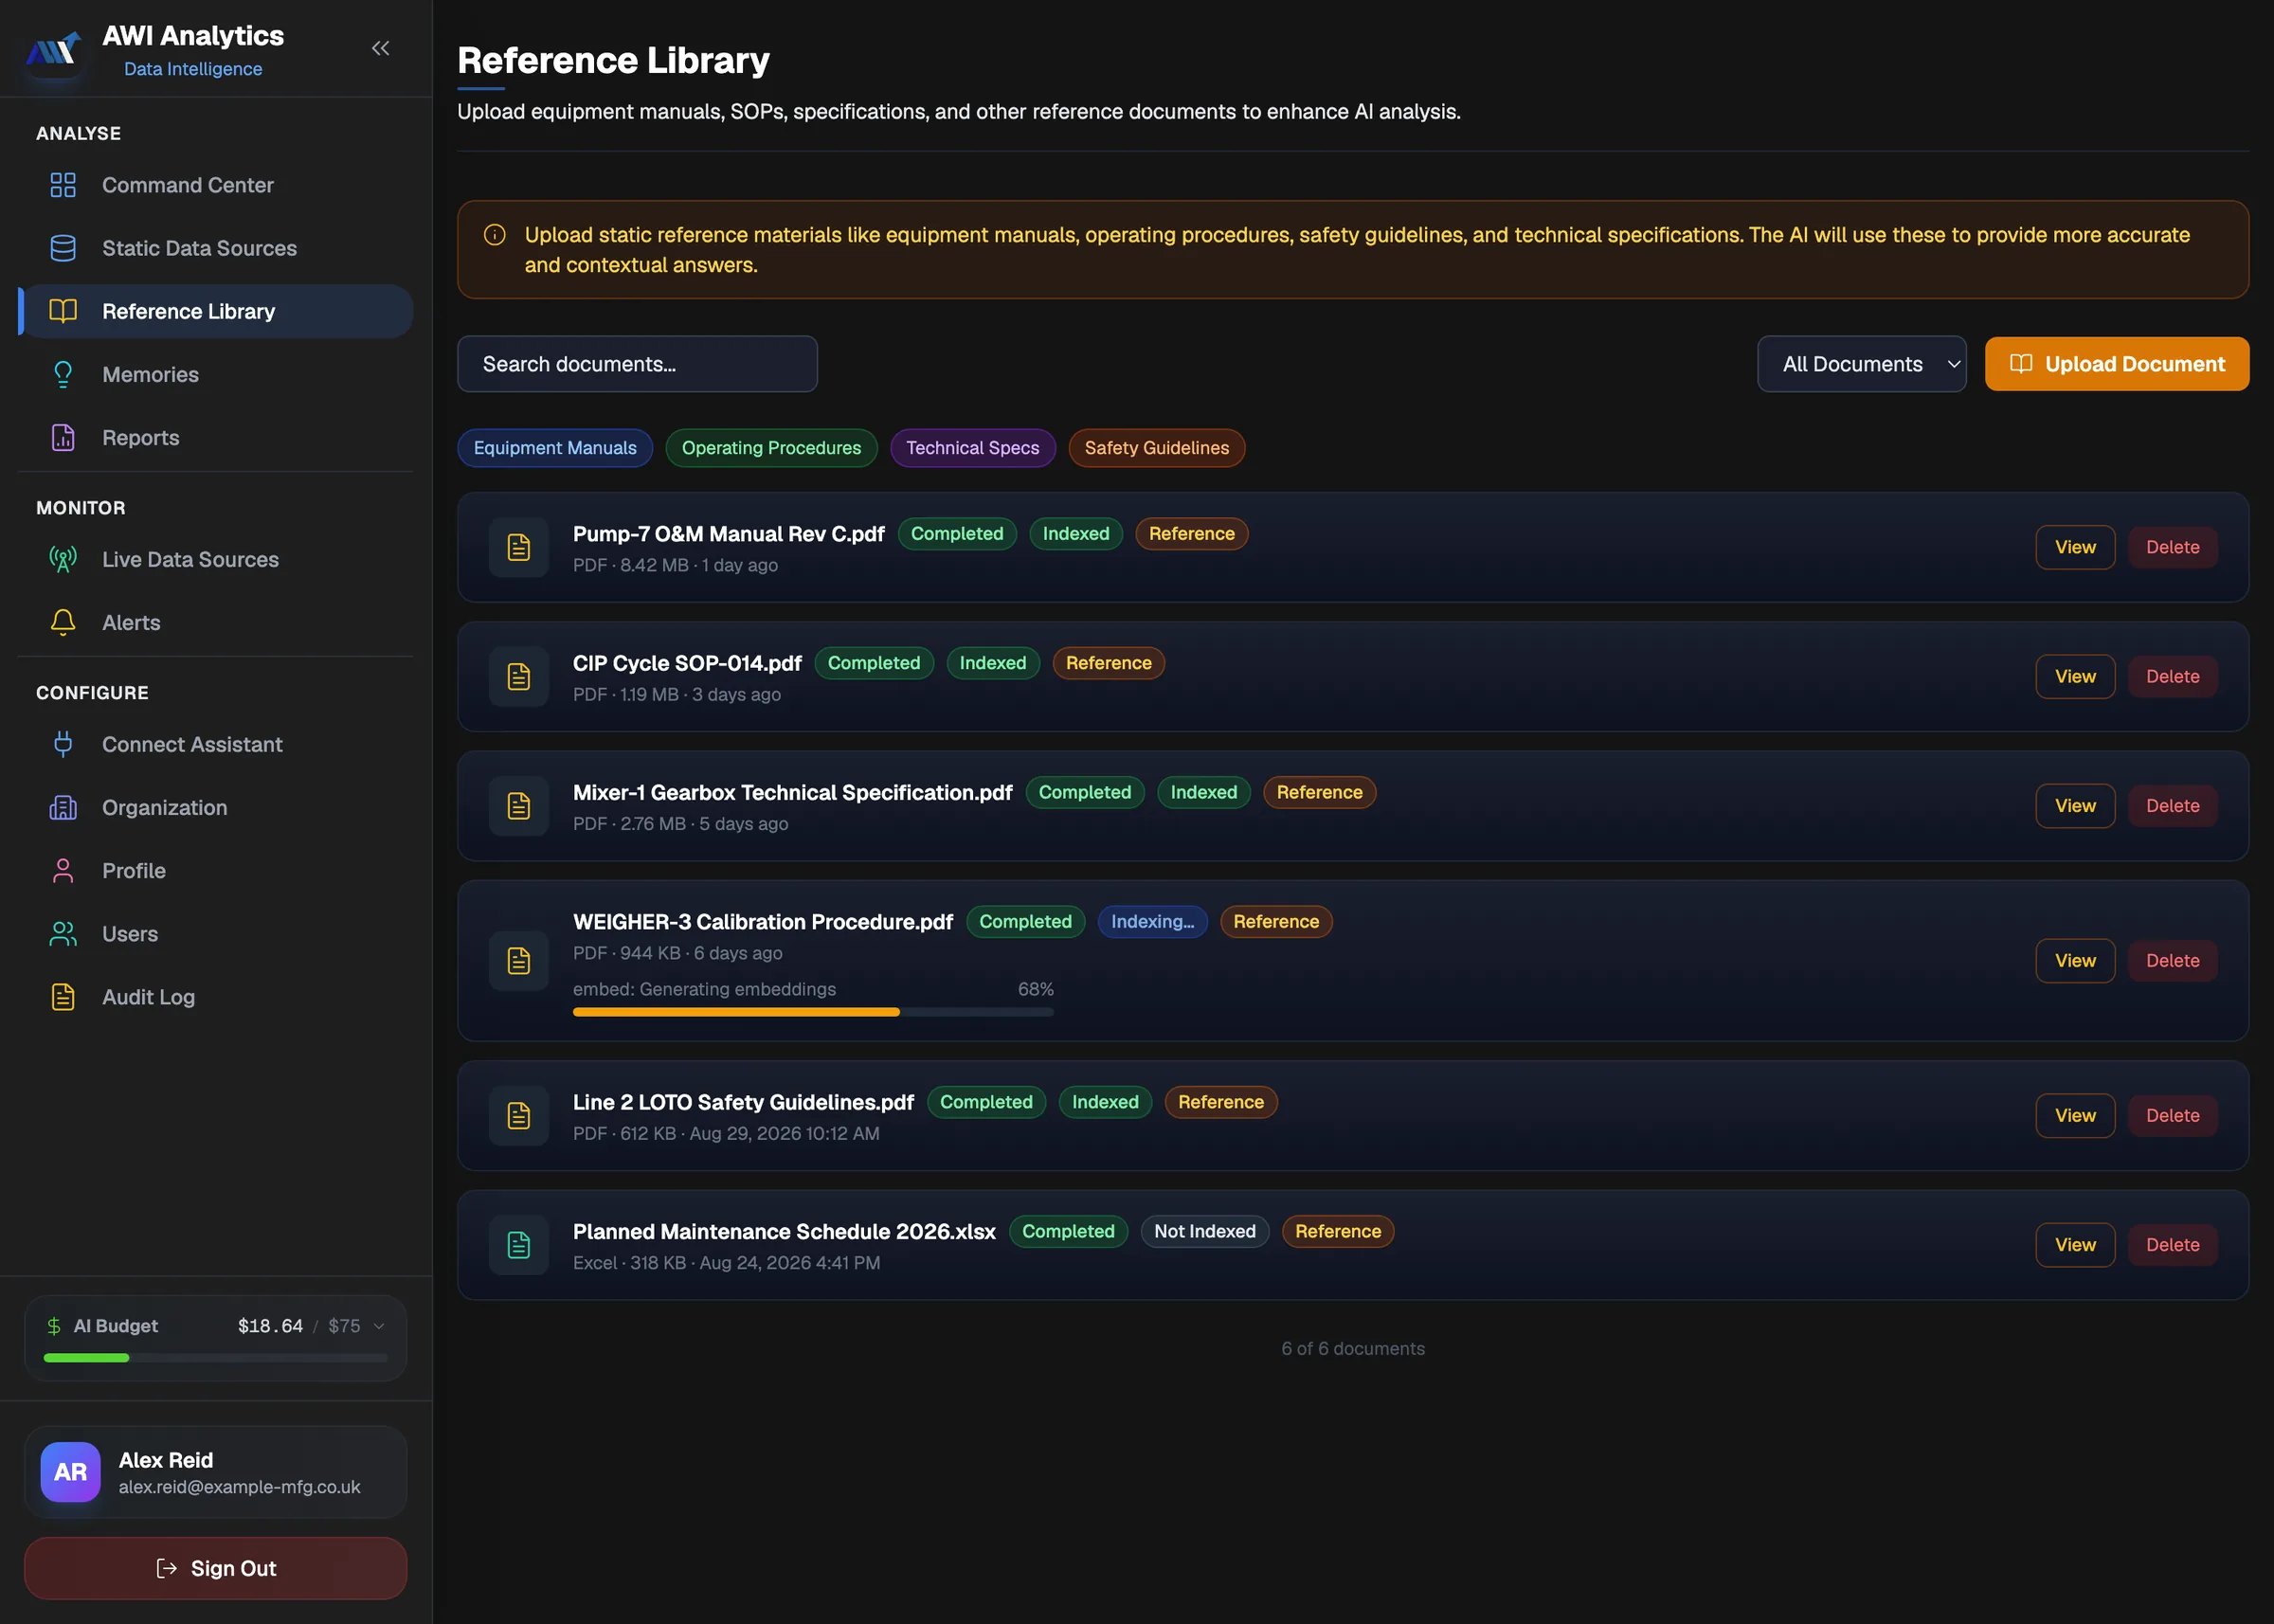
AWI Analytics reference library — equipment manuals, SOPs and specifications with indexing status
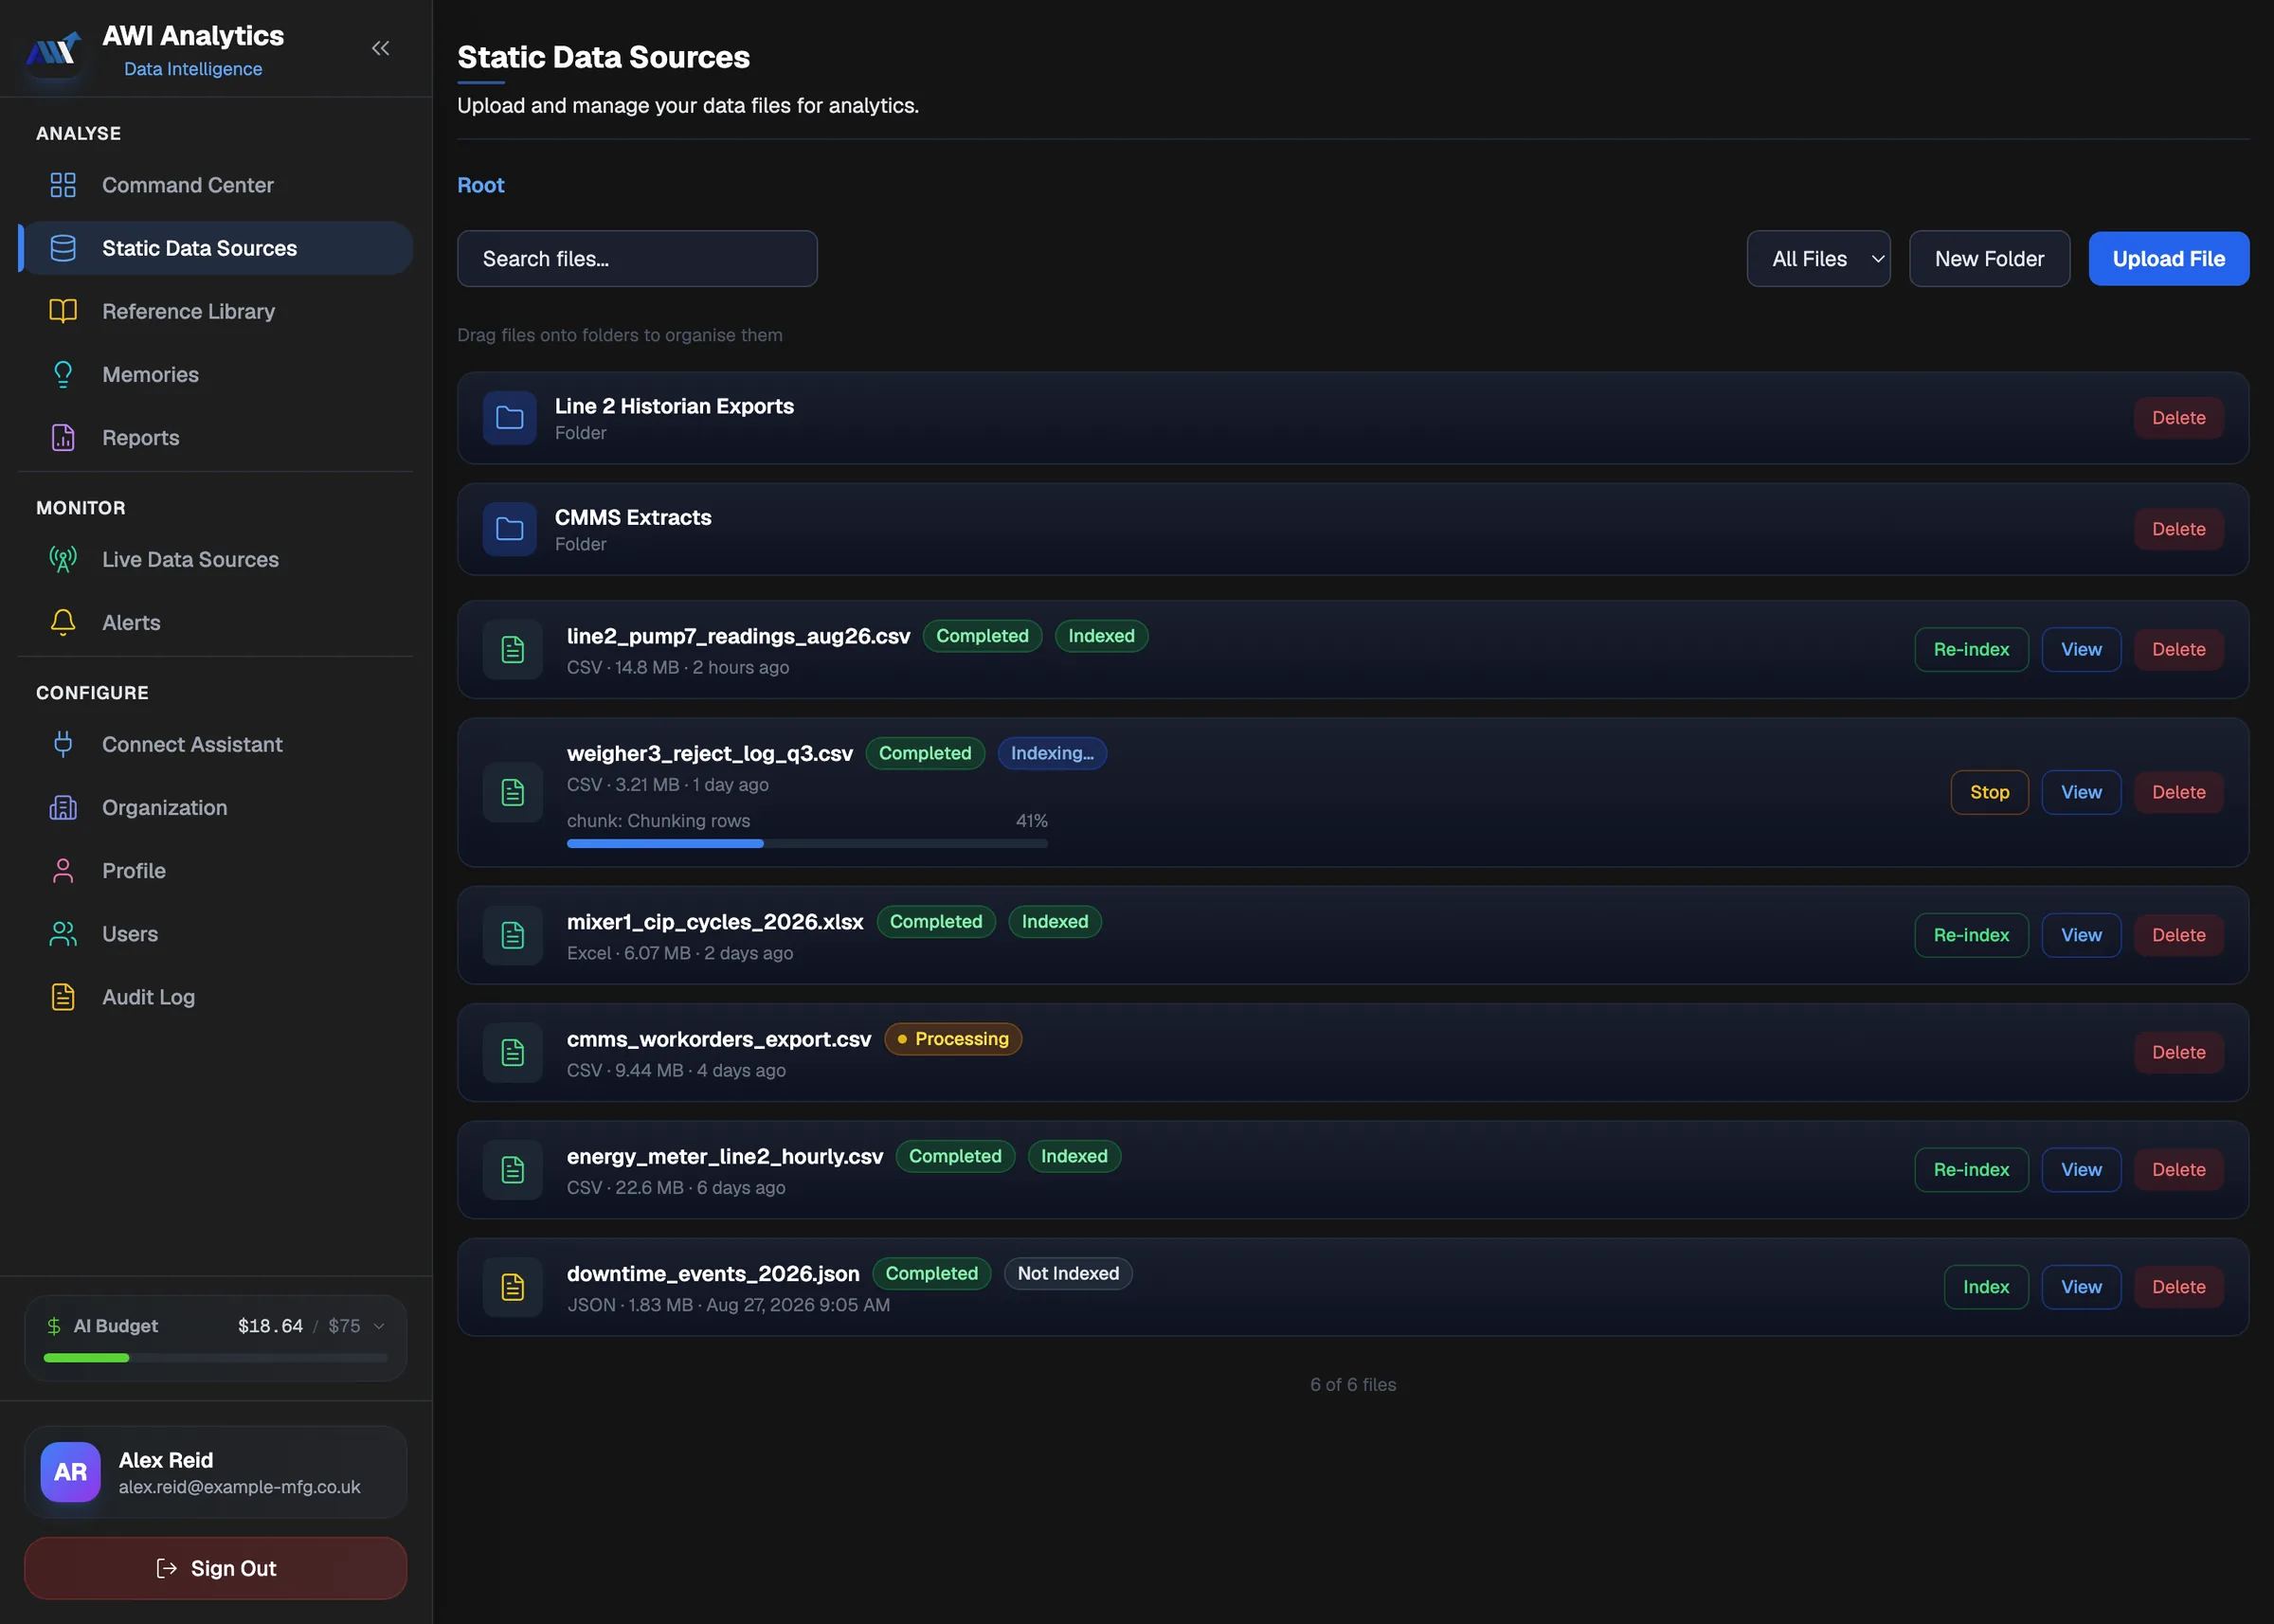
AWI Analytics static data sources — historian exports, CMMS extracts and spreadsheets with indexing status

Detection is only the beginning. When a reading like the amber on PUMP-7 needs a hand on the machine, AWI Labs does the engineering — and the fix is verified against the data that raised it.
COMPARISON

How AWI Analytics compares.

General AI chat is easy but disconnected. Traditional BI is powerful but needs analysts. AWI Analytics is built for the gap between them — the longer argument is in RAG versus traditional BI for engineering data.

CHATGPT · CLAUDE · GEMINI
TRADITIONAL BI — POWER BI, TABLEAU
AWI ANALYTICS
Natural language interface
Yes, for chat
SQL, DAX and dashboards
Ask questions in plain English
Understands your engineering data
No persistent data connection
Yes, but requires manual setup
RAG indexes your data automatically
Analysis done in minutes
Must re-upload each session
Requires analyst. Days or weeks
Instant answers from indexed data
Handles CSV, Excel, JSON, PDF
Limited file size. Context window
Yes, via connectors and data prep
Native multi-format ingestion pipeline
Remembers context across sessions
Context resets each session
No conversational memory
Cognitive memory persists insights
Handles large datasets — 100K+ rows
Token limits — ~50–100 rows max
Yes, designed for big data
Chunked indexing handles any size
Grounded answers — traceable to source
Often invents data or patterns
Yes, shows actual data
RAG retrieves real data with citations
Setup time
Instant, but no data persistence
Weeks to months for full setup
Upload files and start asking
Proactive alerts & anomaly detection
None
Manual threshold configuration
Eight detection models, reviewed hourly
No technical expertise required
Easy to use for chat
Requires SQL, DAX, analysts
Engineers ask, AI delivers
Cost-effective for engineering teams
£20/mo but limited for data
££££ licensing + analyst salaries
Purpose-built for engineering teams
Learns & improves from your usage
No retention between sessions
Static dashboards require rework
Auto-learns from uploads & feedback
AWI ANALYTICS — THE INTELLIGENCE BEHIND CLOSED-LOOP RELIABILITY
INSIDE THE PLATFORM

Eight detection models. One watchdog. One AI review layer.

No single model catches every failure mode, so we don’t use a single model.

Instant guardrails

Static limits and band rules that fire the instant a reading crosses a line you’d never run at — with dwell logic, so a flickering signal doesn’t spam you with alarms.

A statistical ensemble

Seven views of the same signal — trend, baseline shift, drift, spikes, healthy-pattern and multivariate models — plus a watchdog keeping the models honest.

Watchtower AI review

Every hour it correlates what the models raise across all your sensor feeds and interprets anything genuinely worth your time.

Any sensor. Any source.

Wireless LoRaWAN, wired high-frequency IO-Link, or a read-only PLC connection — every source feeds the same detection stack.

Answers from your own data

Ask questions of your maintenance and process data and get grounded answers with the supporting evidence attached.

Alerts that reach you explained

Each model alerts independently, so nothing waits on committee. Urgent things reach you fast and everything reaches you explained.

Different questions, the same asset: schematic panels for eight detection checks — an L1 threshold check, then L2 checks for anomaly envelope, trend (CUSUM), distribution drift (KS/PSI), neural autoencoder, multivariate Isolation Forest, baseline shift and golden divergence — followed by three monitoring-health safeguards (model staleness, data gap, threshold guard) and the L3 Watchtower layer, which reads recorded alert evidence and offers an interpretation for engineering review.
WHAT EACH MODEL ASKSEach detector asks a different question of the same asset, and a finding keeps the detector and the sensor visible rather than collapsing them into one score.

From the shop floor to the boardroom.

AWI Analytics delivers value across your organisation.

Downtime Analysis

Where the unplanned downtime hours went, what they cost, and which assets drive them.

Equipment Diagnostics

Vibration analysis, fault signatures and drift, caught before they become failures.

Management Reporting

Board-ready numbers straight from operational data — no spreadsheet assembly.

INTELLIGENT BY DESIGN

Bring Your Own AI

Connect your own enterprise AI provider — Anthropic, Microsoft, AWS Bedrock — under your contract, in your region.

INTELLIGENT BY DESIGN

Custom Agentic RAG

A retrieval architecture built for engineering data — every answer grounded, traceable, and cited.

FEATURES

What engineers actually do with predictive maintenance data.

The day-to-day work: checking an asset, chasing a recurring fault, pulling the numbers for a shutdown review — without building a dashboard first.
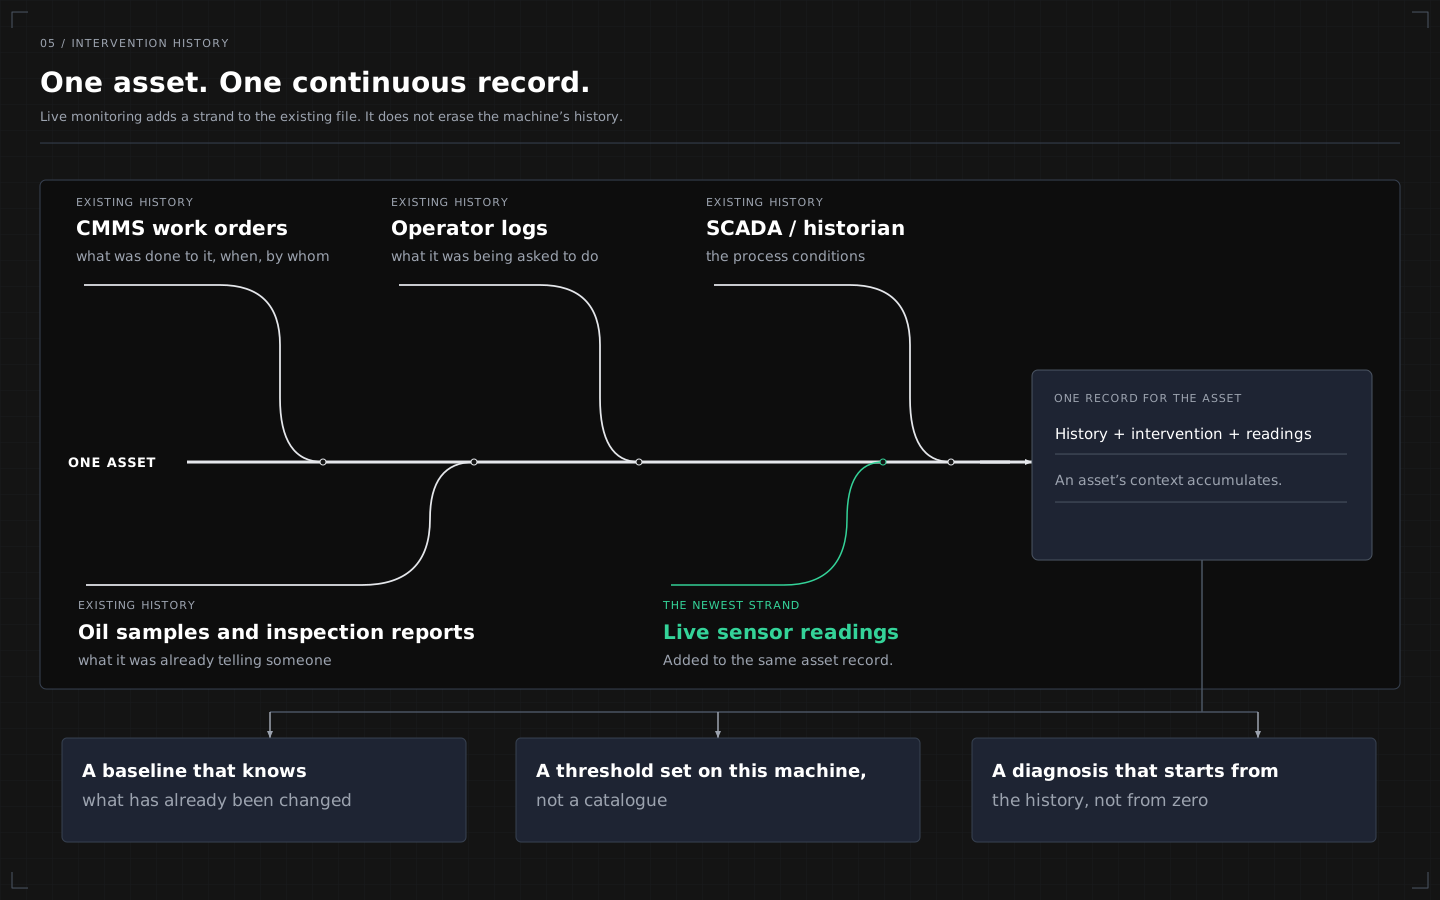
Diagram of a single asset’s record: four existing strands — CMMS work orders, operator logs, SCADA and historian data, and oil samples with inspection reports — joined by a fifth strand of live sensor readings feeding one asset record.
ONE CONTINUOUS RECORDLive monitoring adds a strand to an asset’s existing file rather than starting a new one: work orders, operator logs, historian and SCADA records and inspection reports stay attached to the same asset as the sensor readings arrive.

Automated Analytics

Ask a question, get the analysis — trends, comparisons and anomalies surfaced from your data without building dashboards.

AI Insights

Answers about your equipment and operations, with the supporting evidence attached.

AI Recommendations

Prioritised, actionable recommendations — what to inspect, when, and why it matters.

Live Data Views

Live condition monitoring data alongside your historical records, in one place.

Technical Data Understanding

Understands engineering vocabulary — assets, failure modes, shifts, batches, tags and units.

Instant Setup

No dashboard configuration. Upload files or connect a source and start asking.

SECURITY

Verifiable, neutral, customer-controlled.

Every answer is grounded in your own data with a full audit trail — and you choose which AI provider and region your data touches.
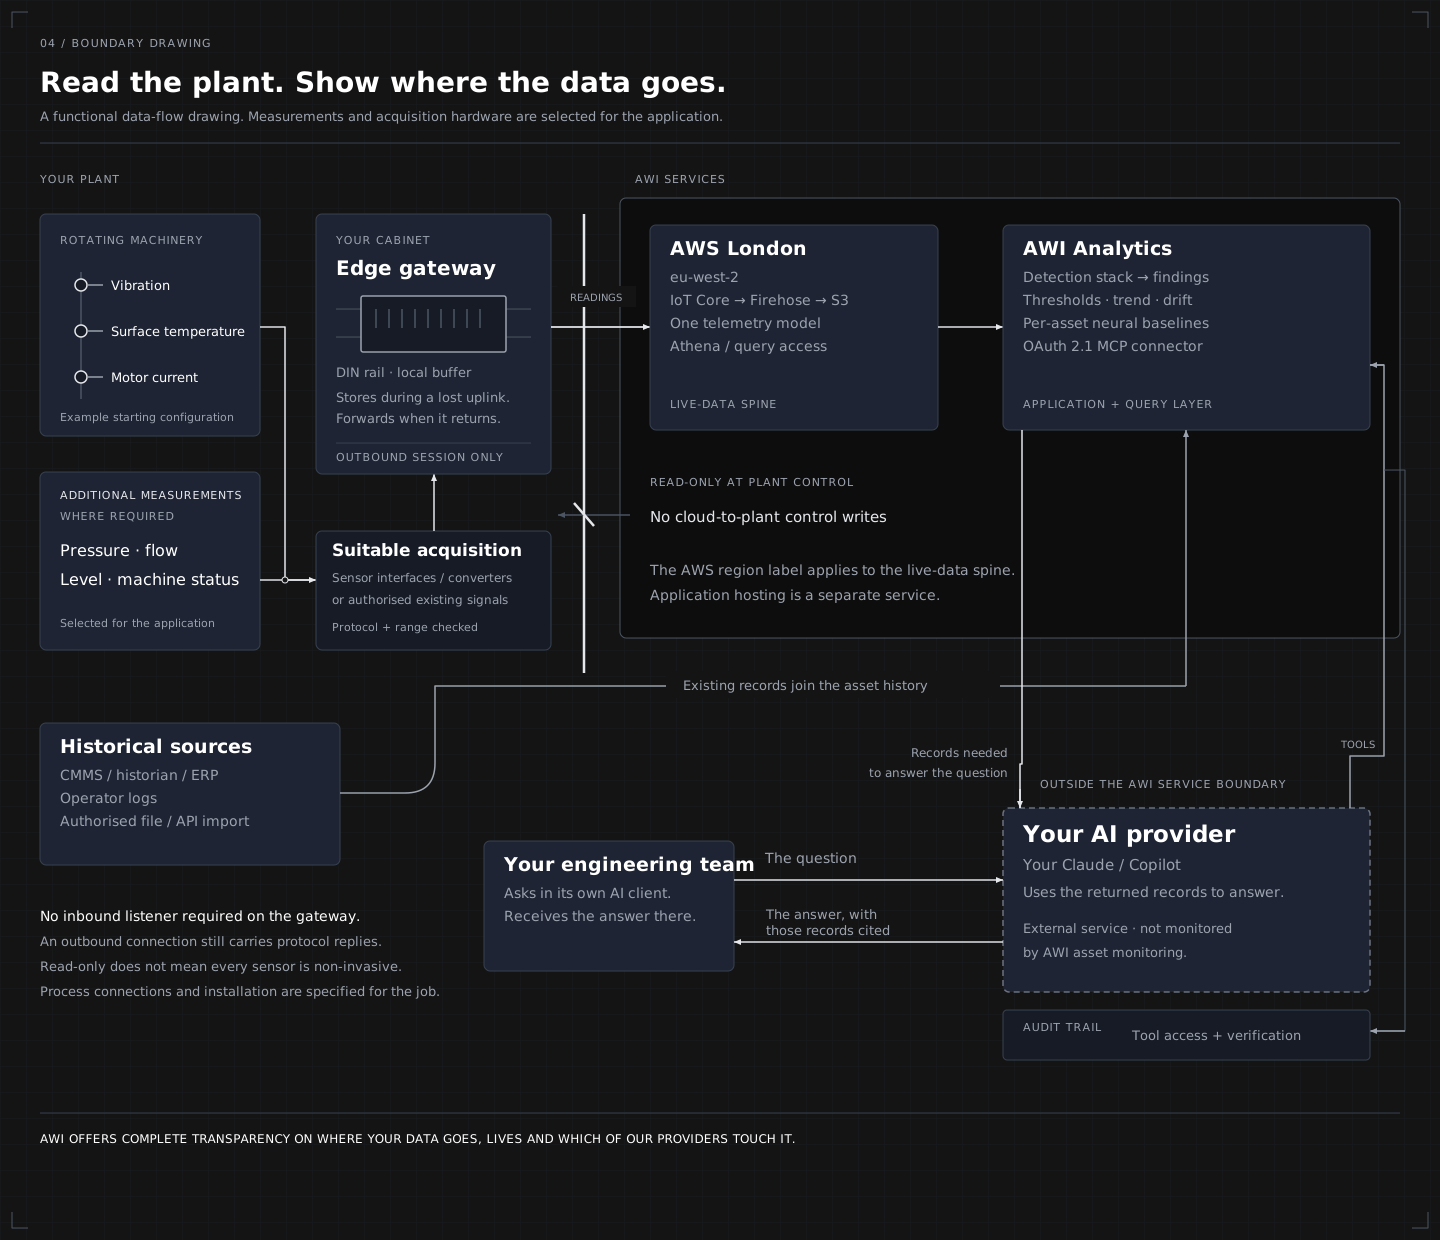
Data-flow diagram: plant sensors feed an edge gateway in the customer’s cabinet, which sends readings outbound to an AWS London telemetry spine and on to AWI Analytics; the customer’s own AI provider sits outside the AWI service boundary.
WHERE THE DATA GOESWhere a reading actually travels: out of the plant through an edge gateway on an outbound session only, into the AWS London telemetry spine, then to AWI Analytics — with your own AI provider sitting outside the AWI service boundary and the question, the records and the answer all on the audit trail.

Token-Based Authentication

JWT authentication with organisation-scoped access.

Encrypted Connections

TLS-encrypted connections to every data source.

Per-Tenant Isolation Inside AWI

Every query, dataset and dashboard is scoped to your organisation — no cross-tenant retrieval, no shared indexes between customers.

Encrypted Cloud Storage

Encrypted at rest in AWS London (eu-west-2) by default.

You Control the AI Path & Audit Trail

Your AI provider, your region, your logs. Every query auditable.

Team Access Controls

Role-based access for engineers, managers and finance.

Any sensor. Any source. One brain.

Connect the tools and data sources you already run — every reading lands in the same telemetry model and runs through the same detection stack. More on manufacturing analytics software for UK SMEs.

CMMS SCADA HISTORIANS ERP SQL DATABASES OPERATOR LOGS FILE UPLOAD CLOUD STORAGE PLC · OPC-UA MODBUS IO-LINK LORAWAN SENSORS IOT DEVICES

Strictly read-only — AWI observes, it never writes to your control systems.