
What OEE Actually Measures
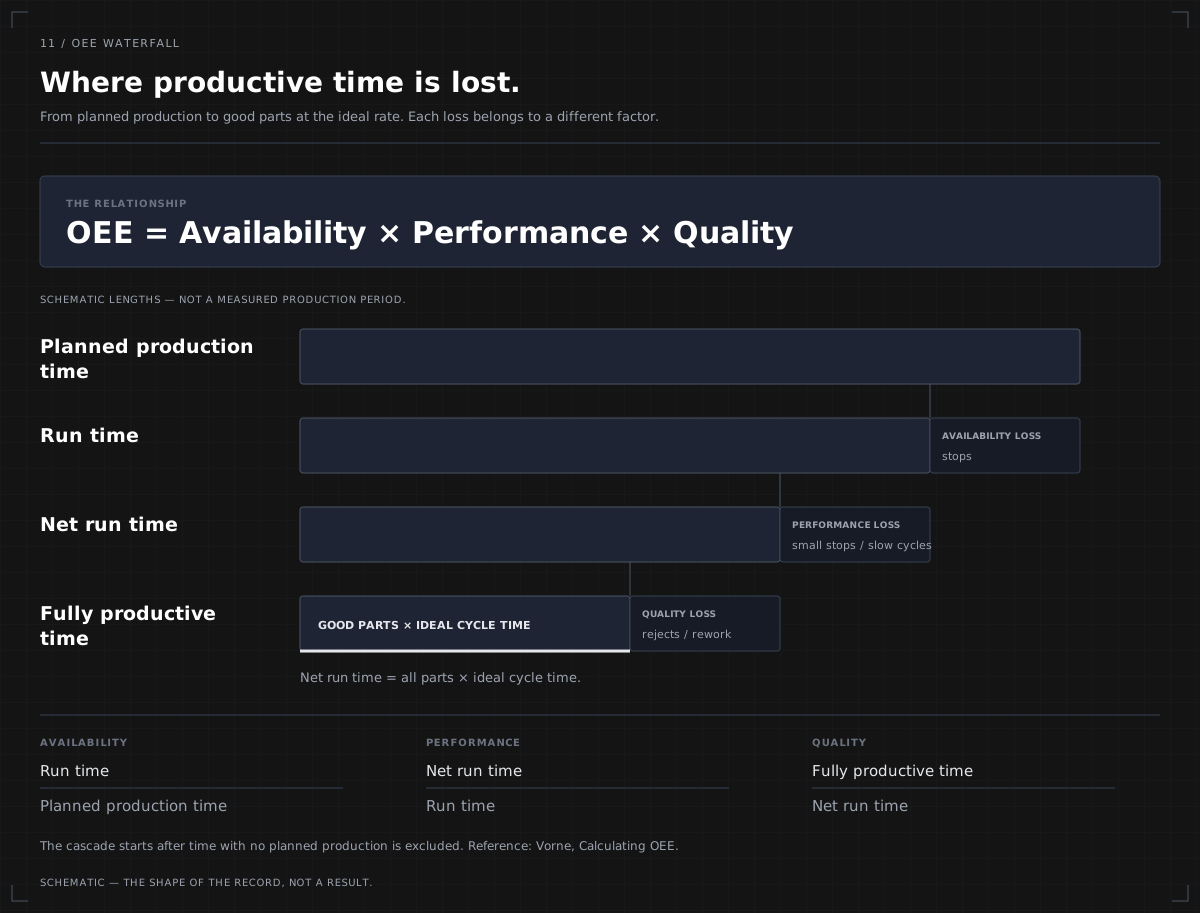
Overall Equipment Effectiveness (OEE) is a single percentage that captures three distinct dimensions of manufacturing performance:
- Availability — the ratio of actual run time to planned production time. Reduced by unplanned stops, breakdowns, and changeovers.
- Performance — how fast the machine runs compared to its theoretical maximum. Reduced by minor stops, slow cycles, and idling.
- Quality — the ratio of good parts produced to total parts produced. Reduced by scrap, rework, and start-up losses.
OEE = Availability × Performance × Quality. According to OEE.com, the standard reference for the metric, world-class OEE for discrete manufacturers is generally considered to be 85% or higher, while typical OEE sits closer to 60%. [1] The gap between these numbers is where most improvement opportunities live.
Why Traditional OEE Calculation Falls Short
Most SME manufacturers calculate OEE manually or through a basic CMMS report. The problem isn't the maths — OEE is a simple multiplication. The problem is the data underneath it.
Manual Loss Categorisation
Traditional OEE measurement requires operators to categorise downtime as it happens: planned vs unplanned, mechanical vs electrical, cause codes, and so on. The data quality depends entirely on how diligently operators tag events in the moment. Most teams find that 20–40% of stops end up in a generic "other" bucket, which makes root-cause analysis impossible.
Slow Reporting Cadence
OEE is most useful when it's near-real-time. Traditional reporting cycles are weekly or monthly — by which point the production conditions that caused a low OEE may already have changed.
The "Six Big Losses" Get Buried
OEE methodology identifies six standard loss categories: equipment failure, setup and adjustments, idling and minor stops, reduced speed, defects in process, and reduced yield at startup. [2] Most reporting only surfaces the first one (equipment failure) clearly. The others get buried in averages.
How AI Changes OEE Analysis
Automatic Loss Categorisation
Instead of relying on operators to tag every stoppage, AI correlates downtime events with sensor data, alarm logs, and shift records to categorise losses automatically. The "other" bucket shrinks from 30% to single digits.
Hidden Loss Detection
Performance losses — slow cycles, micro-stops — are notoriously hard to catch manually. AI models trained on cycle time data spot these patterns continuously, surfacing the chronic small losses that often outweigh the headline failures.
Real-Time OEE
OEE updates continuously as production data flows in, not weekly when reports are compiled. Operators and supervisors can see OEE for the current shift in real time and adjust before the shift ends.
Cross-Asset and Cross-Shift Comparison
AI surfaces patterns that span multiple assets, shifts, or product lines — "your night shift consistently runs 7% slower on Line 2" or "this product code shows 4× the quality losses across all lines." These patterns are invisible to single-line reports.
The Six Big Losses, with AI
| Loss Type | Traditional Detection | AI Detection |
|---|---|---|
| Equipment failure | Manual log entries | Automatic from alarms + downtime data |
| Setup & adjustments | Manual changeover logs | Pattern detection across product changes |
| Idling & minor stops | Often missed | Cycle time analysis catches sub-minute stops |
| Reduced speed | Compared to nameplate manually | Continuous comparison to learned baseline |
| Process defects | Quality team review | Correlated with operating conditions in real time |
| Reduced yield at startup | Rarely tracked separately | Automatically isolated from steady-state runs |
Where to Start: A Practical Approach for SMEs
You don't need full automation to benefit from AI-powered OEE analysis. A practical staged approach:
- Pick one critical line — ideally one that's a known bottleneck, where improvements have outsized impact.
- Connect the data you already have — production counts, alarm logs, downtime records, quality data. These usually exist in disconnected systems.
- Establish baseline OEE using AI to categorise existing data. Most teams discover their reported OEE was higher than reality.
- Focus on the largest loss category first. AI surfaces this automatically. Often it's not equipment failures — it's minor stops or reduced speed.
- Iterate. Use the platform to ask "what changed when OEE dropped?" rather than just observing that it did.
The biggest single OEE improvement most operations can make isn't operational — it's measurement. You can't improve what you can't see, and most teams can't see at least a third of their losses today.
What "Good" Looks Like
An AI-supported OEE programme is working when:
- The "other" downtime bucket is below 5%, not 30%.
- OEE is visible in real time on the production floor, not in monthly reports.
- The largest loss categories are being actively addressed, not just reported.
- Cross-shift and cross-asset patterns surface automatically.
- The maintenance team can ask "why did OEE drop on Line 3 yesterday?" and get an answer in minutes.
This is the level of visibility that used to require dedicated MES software and a six-figure implementation budget. Modern AI-powered platforms make it accessible to SMEs without that overhead. Combined with AI anomaly detection and a shift to predictive maintenance, OEE analysis becomes the foundation of operational improvement rather than just a number on a wall chart.
Key Takeaways
- OEE = Availability × Performance × Quality. World-class is 85%; typical is 60%.
- Traditional OEE measurement is incomplete because manual loss categorisation misses 20–40% of root causes.
- AI automates loss categorisation, surfaces hidden losses, and provides real-time visibility across assets and shifts.
- The Six Big Losses become visible, not just the headline equipment failures.
- Start with one critical line, connect existing data, establish a real baseline, and iterate.
- The biggest gain for most SMEs isn't operational — it's seeing the losses that were always there but invisible.
- OEE.com / Vorne Industries. "OEE Factors" — benchmark percentages (60% typical / 85% world-class for discrete manufacturers). oee.com — OEE Factors and Benchmarks
- Vorne Industries. "The Six Big Losses" — reference guide to OEE loss categories. oee.com — The Six Big Losses (Vorne Industries)