
This is the theory underneath everything we've written about condition monitoring being the layer deeper than uptime data — the reason condition data can speak in the future tense at all. It's a short piece of theory, it comes from one of the most consequential engineering studies ever written, and it has one immediate, practical message for any plant that keeps getting surprised by breakdowns.
One Curve, Two Points
The P-F curve plots a machine's health against time as a failure develops. Two points on it matter. P is the potential failure — in Reliable Plant's definition, “a detectable symptom or warning sign that a functional failure is in the process of occurring.” F is the functional failure — “the point where an asset fails to perform a required function.” [1] Note the wording: P isn't where deterioration starts. The failure is already in progress before P — P is simply the first moment it becomes detectable.
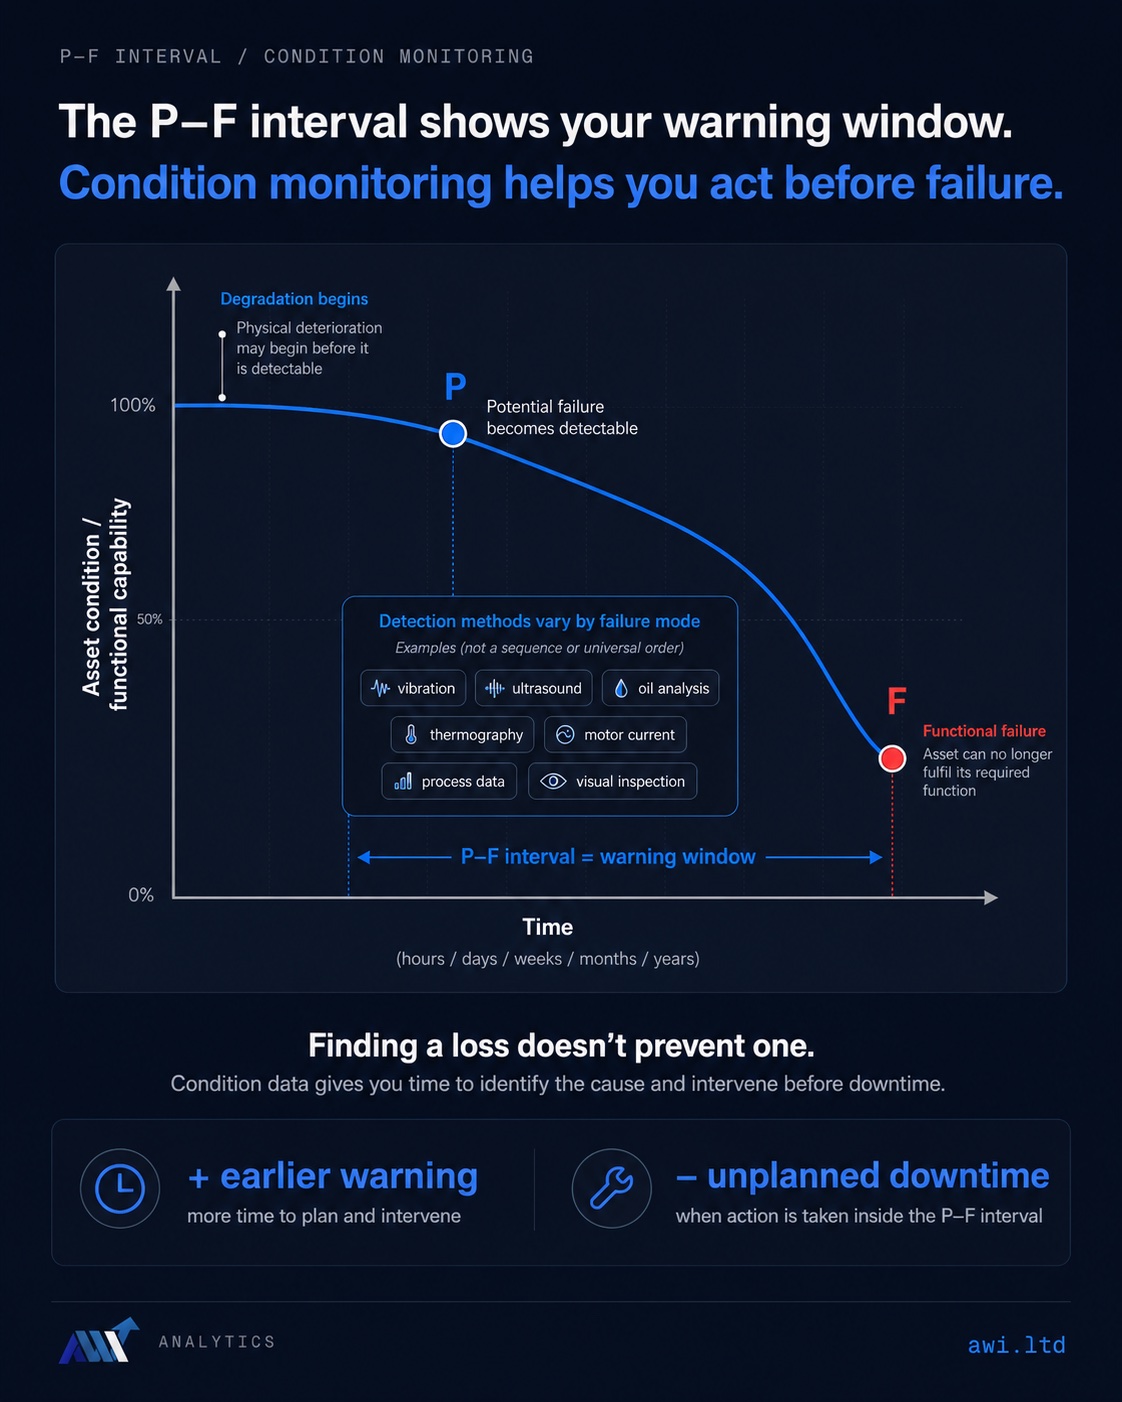
The distance between the two points is the P-F interval: “the time or cycles between the initial detection of the potential failure condition and the time of the actual functional failure.” [1] That interval is the entire playing field of predictive maintenance. Everything — every sensor, every analysis technique, every alert — is an attempt to catch the failure as far left in that window as possible, because the further left you are, the more time you have to diagnose, plan, order parts and intervene on your schedule instead of the machine's.
The detail that matters most when reading it: a P-F curve describes a failure mode, not a machine. A bearing wearing out, the same bearing losing its lubricant, and a winding fault in the motor driving it are three separate curves with three separate intervals — and a single failure mode can present several detectable symptoms, each with a P-F interval of its own. [1] The detection methods in the diagram are examples for exactly that reason: which method detects first is a property of the failure mode, not of the technology. It’s also how a monitoring programme is engineered in practice — identify the asset’s credible failure modes first, then select the detection method and measurement interval for each mode, weighted by the consequences of that mode failing. [7]
Where the Curve Came From
This isn't marketing material — it's one of the oldest and best-tested ideas in reliability. Its lineage runs back to F. Stanley Nowlan and Howard F. Heap's 1978 report Reliability-Centered Maintenance, written at United Airlines — the study of aircraft maintenance that Reliabilityweb describes as “the 1978 DOD document that all current RCM was derived from.” [2][3] The P-F curve itself was popularised by John Moubray's RCM II books, which used it to explain how on-condition — predictive — maintenance works. [2] Half a century of reliability practice, in aviation and then in industry, has been built on the observation the curve encodes: most failures give warning, and the warning is measurable before it is obvious.
The same report is where maintenance's most quietly radical statistic comes from. Analysing United Airlines component data, Nowlan and Heap found the failure curves fell into six basic patterns — and that “some 89 percent of the items analyzed had no wearout zone,” meaning no operating-age limit could improve their reliability; only around 11% might benefit from one. [4] NASA’s RCM guide cites follow-up studies (United Airlines, Bromberg, US Navy) putting random, non-age-related failures at 77–92% of the total. [5] That is the statistical reason a calendar-based PM schedule alone can’t protect a plant: most failures don’t follow the calendar — so the only way to catch them is to watch the machine’s condition, which is exactly what the P-F window makes possible.
The Interval Is Everything — and Technique Decides Its Size
Here's the practical part. How much warning you get isn't fixed — it depends on how you're listening. Each detection method picks the failure up at a different point on the curve. Published typical figures for the warning window each method gives: [6]
Reliable Plant gives a concrete bearing example of the same idea: “The first symptom may be unusual vibration detectable by vibration analysis around six months. The second symptom may be sound detectable at three months using airborne ultrasound. The third symptom may be increased heat detectable at one month prior to the bearing failing.” [1] The exact sequence shifts with the asset and the failure mode — the ranges overlap for a reason — but the shape of the story never changes: instrumented measurement buys you months. Your senses buy you days.
This is why vibration analysis and fluid analysis sit at the heart of condition monitoring: they read the left side of the curve, where the warning is long and the options are open.
The Human-Senses Trap
Look at the bottom two bars again. A plant that relies on operators noticing something wrong — a new noise, a hot casing on the walk-round — isn't running without condition monitoring. It's running condition monitoring with the shortest possible warning window. By the time a bearing is audible, the published figure gives you one to four weeks; by the time it's hot to the touch, days. [6] That's not enough time to order a bearing on normal lead times, let alone plan the stop around production.
“If you can hear it, you're weeks away. If you can feel it, you're days away. The plan-your-own-shutdown window closed months earlier — while the machine was still quiet.”
In P-F terms, “we'll notice when something's wrong” is a decision to detect at the far right of the curve — which is functionally a decision to run to failure, with a few days' notice as a courtesy.
How Often Do You Have to Look?
The curve also answers a question every maintenance planner asks: how frequently do we need to measure? The logic is unforgiving: “to detect a potential failure before it becomes a functional failure, the task frequency must be less than the P-F interval.” [7] Measure less often than the window is long, and a failure can begin and complete between two inspections — invisible from start to finish. Conventional RCM guidance treats half the P-F interval as a usually-sufficient rule of thumb, with higher-risk failure modes warranting tighter fractions. [7]
Work the arithmetic and you see why monthly manual routes so often miss things: a fault with a six-week P-F interval needs measuring at least every three weeks to be caught reliably. It's also why the industry has moved toward continuous online monitoring — when the sensor samples constantly, the inspection-interval question dissolves, and P gets caught the day it becomes detectable. That standards-grade framing of condition monitoring as a continuous procedure, not an occasional check, is exactly how ISO 17359 — the umbrella standard for condition monitoring — lays it out. [8]
What the Curve Doesn't Do
One honest caveat, because it's where monitoring projects most often disappoint. The P-F curve promises warning — it does not promise rescue. Detecting a failure at P buys you months of options; it doesn't diagnose the root cause, order the parts, realign the coupling or verify the repair. Detection only pays when someone uses the window it opens. A long P-F interval with no one acting inside it produces exactly the same breakdown as no monitoring at all — just with better documentation.
That's the argument we make at length in closed-loop reliability: the alert is the beginning of the job, not the end of it. AWI's model is built around the whole window — software reading your machine data continuously to catch P early, and engineers who come to site to diagnose the cause, engineer it out and verify the fix held. Detecting the P point is the easy half; getting an engineer to the machine inside the interval is the half that decides whether the curve was any use, and that is the work of AWI Labs. If you want to know what the right side of the curve currently costs you, the downtime cost calculator will put a number on it.
Frequently Asked Questions
What is the P-F curve?
The P-F curve is a graph used in reliability engineering that shows a machine's health declining over time as a failure develops. It marks two points: P, the potential failure — the first detectable warning sign that a failure is in progress — and F, the functional failure, where the asset can no longer perform its required function. The curve's message is that failures develop gradually and announce themselves before the machine actually stops.
What is the P-F interval?
The P-F interval is the time between the first detectable sign of a developing failure (P) and the point of functional failure (F). It is the warning window: detect the problem early in the interval and you have time to diagnose it, plan the work, order parts and intervene on your own schedule. The entire practice of condition monitoring operates inside this window.
Which condition monitoring technique detects failures earliest?
Published typical figures put ultrasound earliest at 1–12 months of warning before functional failure, followed by vibration analysis at 1–9 months, with oil analysis, performance monitoring and thermography at 1–6 months. Human senses come far later: audible noise gives roughly 1–4 weeks and heat you can feel by touch only 1–5 days. The exact interval always depends on the asset and the specific failure mode.
How often should you measure relative to the P-F interval?
The inspection or measurement interval must be shorter than the P-F interval, otherwise a failure can begin and complete between two inspections without ever being seen. Conventional RCM guidance treats an interval of half the P-F interval as usually sufficient, with higher-risk failure modes warranting a smaller fraction. Continuous online monitoring effectively removes the question, because the asset is being measured all the time.
Key Takeaways
- Failures develop; they don't happen. The day the machine stops (F) is the end of a process that became detectable much earlier (P).
- The P-F interval is your warning window — the whole practice of predictive maintenance is about catching failures as far left in it as possible.
- Technique decides how much warning you get — published figures run from 1–12 months for ultrasound and 1–9 for vibration down to days for touch. [6]
- Relying on human senses is late-curve monitoring — audible noise and heat give weeks to days, which is run-to-failure with a courtesy note.
- Measure more often than the window is long — the task frequency must be less than the P-F interval; half of it is the usual rule of thumb, and continuous monitoring dissolves the question. [7]
- The curve gives you time — not a fix. The warning only pays if someone diagnoses the cause and engineers it out inside the window. That's the closed loop.
- Reliable Plant (Noria Corporation). "Use P-F Intervals to Map, Avert Failures" — definitions of potential failure, functional failure and the P-F interval; worked bearing example. reliableplant.com — P-F intervals
- Accendo Reliability (Mike Sondalini). "A Common Misunderstanding About Reliability Centred Maintenance" — RCM first described in the 1978 Nowlan & Heap report for United Airlines; P-F curve popularised by John Moubray's RCM II. accendoreliability.com
- Reliabilityweb. "Reliability Centered Maintenance report by F. Stanley Nowlan and Howard F. Heap" — hosts the 1978 DoD report from which current RCM derives. reliabilityweb.com — the 1978 report
- Nowlan, F.S. & Heap, H.F. (1978). Reliability-Centered Maintenance — six failure patterns; “some 89 percent of the items analyzed had no wearout zone” (11% might benefit from an operating-age limit). omdec.com — full report (PDF)
- NASA. Reliability-Centered Maintenance Guide (2008) — studies finding random failures at 77–92% of total (Figure 4-5). nasa.gov — RCM guide (PDF)
- Reliability Connect (Tod Baer). "Understanding Failures and the Potential Failure (P-F) Curve" — typical P-F intervals by technology: ultrasound 1–12 months, vibration 1–9 months, oil analysis / performance monitoring / thermography 1–6 months, audible noise 1–4 weeks, hot to touch 1–5 days. reliabilityconnect.com
- Reliabilityweb (Gary West). "RCM: On-Condition Task Interval Determination" — task frequency must be less than the P-F interval; half the P-F interval usually sufficient. reliabilityweb.com — task intervals
- International Organization for Standardization. ISO 17359:2018 — "Condition monitoring and diagnostics of machines — General guidelines". iso.org — ISO 17359:2018