
This guide is part of the same series as our guide to vibration analysis and sits inside our complete guide to predictive maintenance for SMEs. Vibration tells you something is wrong. The fluid very often tells you first — and tells you what.
The Plant as a Circulatory System
Think about where your unplanned downtime actually comes from. Gearbox failures are lubrication failures caught late. Hydraulic failures are overwhelmingly contamination failures — industry studies consistently attribute the majority, often quoted at 70–80%, to fluid contamination rather than component defects. [1] Pump failures trace back to cavitation, erosion or a lubricant that stopped doing its job. Pipework and manifold failures are corrosion and abrasion working quietly for years until a wall gives way.
Different symptoms, one root discipline: fluid reliability. Keep the fluid healthy, keep it clean, keep it moving, and protect the surfaces it touches — and a remarkable share of your failure modes never develop. Lose sight of it, and every stoppage arrives at the worst possible time, priced at whatever an hour of unplanned downtime costs your site.
The economics of getting this right are well documented. Research published by Noria Corporation's Machinery Lubrication — the industry reference for lubrication management — found that oil analysis as part of a condition monitoring programme can extend component life by 3–8 times compared to time-based replacement. [1] And on the containment side, AMPP (formerly NACE) put the global cost of corrosion at $2.5 trillion a year — with 15–35% of it avoidable through existing corrosion-management practice. [2]
Half One: Fluid Analysis — Reading the Bloodstream
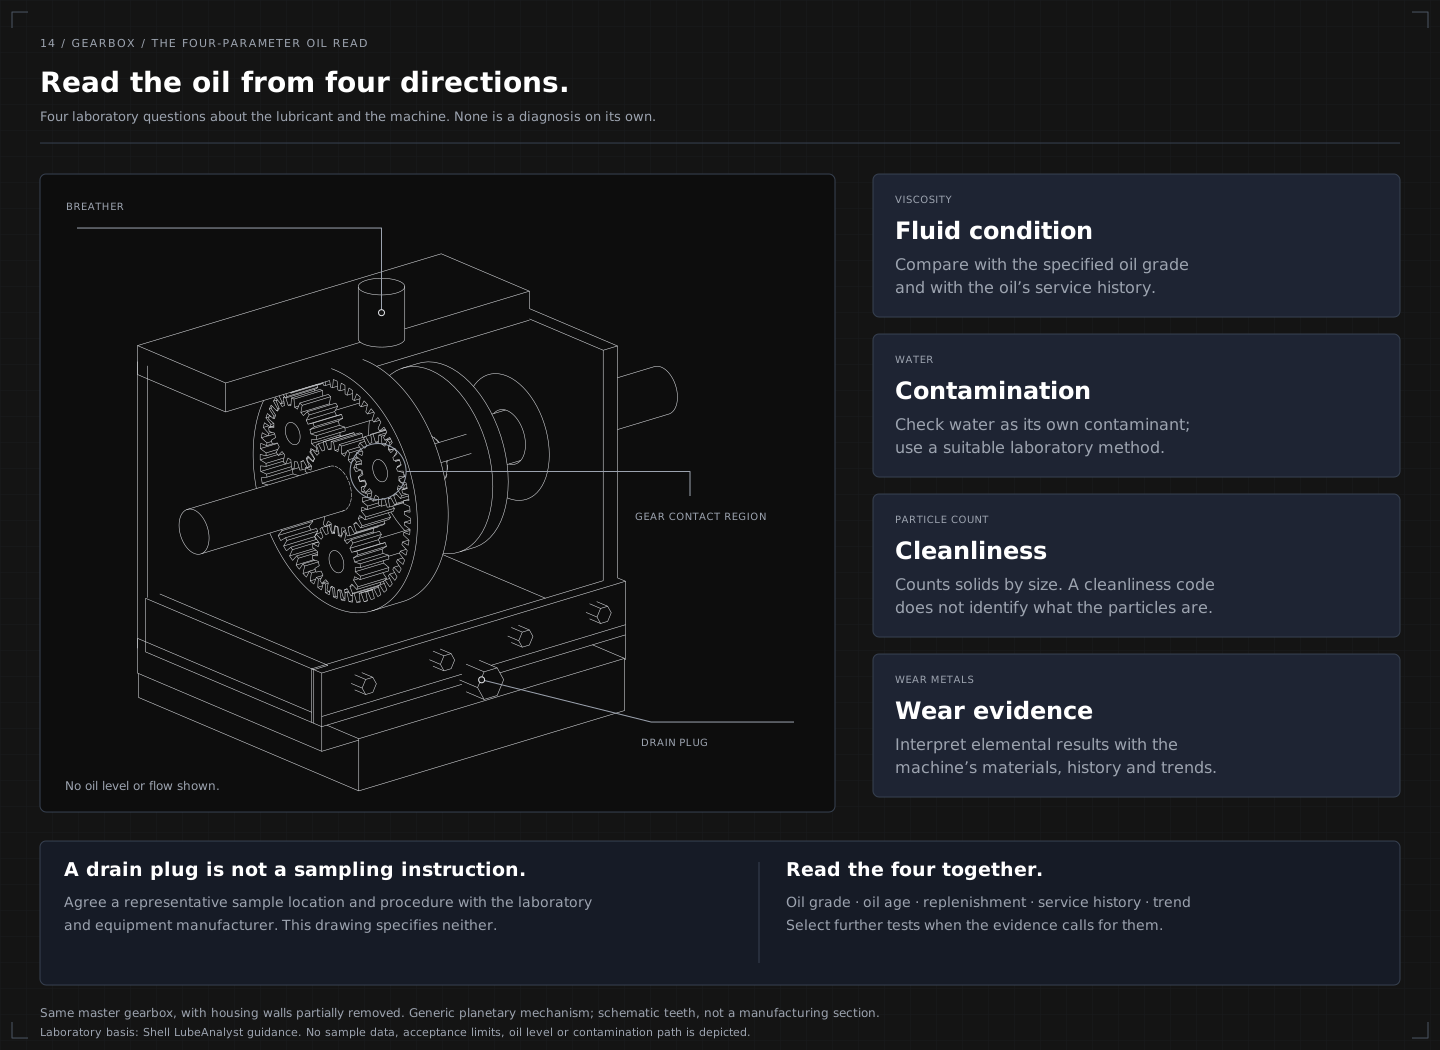
Every lubricated or hydraulic system on site is running a diagnostic lab you've already paid for: the fluid inside it. A standard lab analysis reads it the way a doctor reads a blood test, across three families of measurement:
Wear metals — what is wearing?
Because different components are made of different alloys, the metals suspended in the oil act as a fingerprint that localises wear to a specific part — without opening the machine. Iron points at gears, shafts and rolling elements; copper at bushings, cages and cooler cores; chromium at rings and some bearings; lead and tin at white-metal plain bearings. A rising iron trend with flat copper means gear wear, not bearing wear — the difference between a targeted, planned inspection and an exploratory rebuild.
Contamination — what's getting in?
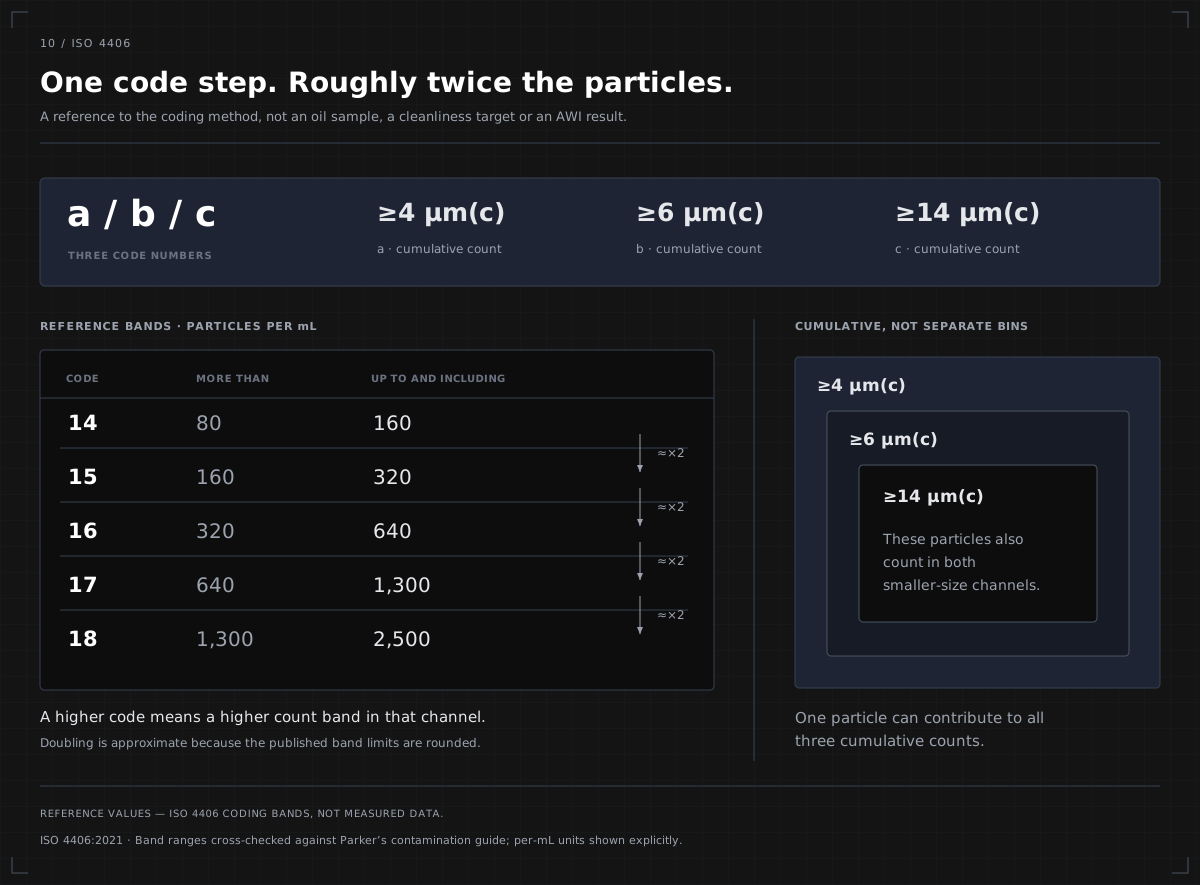
Particle count (ISO 4406) is the headline cleanliness measure for hydraulic and circulating systems, reported as a three-number code — e.g. 18/16/13 — counting particles at ≥4 µm, ≥6 µm and ≥14 µm. Each step up a code number represents a doubling of particles, so a system drifting from 18/16/13 to 20/18/15 isn't "two points worse" — it's carrying roughly four times the particle load. [3] Silicon is the classic dirt signature: rising silicon means breathers, seals or filtration are letting the outside world in, and abrasive wear follows close behind. Water strips the oil film, corrodes surfaces and measurably shortens bearing fatigue life even in small amounts.
Fluid condition — is the oil itself still fit for service?
Viscosity is the single most important property of any lubricant — a meaningful shift in either direction means the film thickness your components were designed for no longer exists. Oxidation and acid number track how far the base oil has degraded; heat is the accelerant, and as a rule of thumb from bearing-industry research, every 15°C above optimal operating temperature roughly halves lubricant life. [4] Additive depletion is the quiet one: once the anti-wear and anti-oxidant packages are consumed, degradation goes non-linear.
A worked example: the gearbox that didn't need replacing
Quarterly samples on a main-drive gearbox show iron climbing 40 → 70 → 120 ppm across nine months, silicon creeping up in step, viscosity stable, copper flat. The pattern reads: abrasive gear wear driven by dirt ingress — a failed breather or weeping seal — caught early, bearings not yet involved, oil still serviceable. The intervention is a breather, a seal, a flush and a re-sample: a few hundred pounds at a planned stop. Left invisible, the same pattern ends in gear tooth damage, secondary bearing failure and an unplanned rebuild measured in tens of thousands — plus the downtime.
The most valuable output of fluid analysis isn't a warning that something will fail. It's the evidence that lets you repair and protect an asset instead of replacing it — and schedule that work on your terms.
Half Two: Protecting What the Fluids Touch
Fluid analysis looks after the fluid. But the fluids are simultaneously attacking their containment — and that half of the problem is just as much reliability engineering. Abrasive slurries erode elbows, tees and agitator blades. Corrosive process fluids pit manifolds, vessel walls and pump internals. Cavitation eats impellers and volutes. Bulk solids grind away at silos and chutes. It works quietly, for years, until a wall thickness or a clearance crosses the line — usually mid-shift.
The traditional response is run-to-failure and replace: a new pump, a fabricated pipe spool, a long-lead casting. But for a large class of corrosion, erosion, pitting and abrasion damage, replacement is the last resort, not the first. Modern engineered repair composites and protective coating systems — polymer and ceramic-filled materials applied to prepared surfaces — can rebuild lost material and shield pipework, manifolds, silos, agitators and pump internals against the same attack that caused the damage. Applied at a planned stop, they routinely turn a replacement decision into a repair-and-protect decision at a fraction of the cost and lead time.
The reliability arithmetic is the same as on the lubrication side: longer asset life and increased MTBF, fewer repeat repairs and shutdowns, reduced maintenance labour and replacement spend, and improved availability — which is to say, OEE that stops bleeding through the availability term.
The catch — and the reason this belongs in a fluid analysis article — is that rebuild-and-protect is only an option while there's something left to rebuild. Erosion and corrosion caught at 20% wall loss is a coating job at the next planned stop. Caught at the leak, it's an emergency fabrication with the line down. The decision window is opened by exactly the same discipline as the gearbox example: monitoring and trending — wall-thickness inspection results, pressure differentials, flow performance, pump efficiency — so the damage is found while the cheap options are still on the table.
The Repair–Protect–Replace Ladder
Put the two halves together and fluid reliability becomes a ladder of escalating interventions, each rung cheaper than the one above it:
- Correct the environment — breathers, seals, filtration, storage and handling. Stops the cause for the price of consumables.
- Recondition the fluid — filter carts, dehydration, flush and refill. Restores the film that protects every surface downstream.
- Repair the identified component — wear metals and inspection data told you which component, so the job is targeted and planned, not exploratory.
- Rebuild and protect the surfaces — engineered composite repairs and protective coatings where the duty is erosive or corrosive, so the same damage doesn't simply restart.
- Replace — the last rung, taken when the data says remaining life is genuinely spent, and taken as a planned event.
Each rung on that ladder is physical work on the asset, done at the machine rather than in a report. AWI Labs is the side of the partnership that carries it out.
Every failure you intercept low on the ladder shows up directly in the numbers reliability engineering answers to: MTBF up, repeat repairs down, maintenance spend down, availability and OEE up. That's the whole philosophy in one line: repair, protect, and keep production moving.
The Standards Worth Knowing
Fluid reliability is unusually well served by international standards — useful both for building a defensible programme and for writing specifications that contractors and labs can't misread. These are the ones that earn their place on an SME reliability engineer's shelf:
| Standard | What it covers | Why it matters |
|---|---|---|
| ISO 4406 | Cleanliness coding of solid-particle contamination in fluids | The headline number on every hydraulic fluid report — each code step doubles the particle load |
| ISO 4021 | Extracting fluid samples from lines of an operating system | Consistent, in-service sampling — the foundation every other result depends on |
| ISO 3448 | ISO viscosity grades (VG) for industrial lubricants | The VG number on the drum — confirms the right oil is in the right machine |
| ISO 17359 | Condition monitoring and diagnostics — general guidelines | The umbrella framework for building a monitoring programme; references the technique-specific standards |
| ISO 18436-4 | Qualification of field lubricant analysis personnel | Who is competent to interpret results — oil analysis's answer to the Cat II vibration analyst |
| ISO 15243 | Rolling bearing damage and failure modes | Puts a name and a root cause to the failure the wear metals are hinting at |
| ISO 12944 | Corrosion protection of steel structures by protective coating systems | The reference framework when the answer is protect, not replace — environments, systems and durability classes |
| ISO 8501-1 | Rust grades and surface preparation grades before coating | The “Sa 2½” spec that decides whether a protective coating actually performs |
You don't need to own them all on day one. ISO 4406 and ISO 4021 cover the sampling-and-cleanliness core; ISO 17359 shapes the programme; ISO 15243 closes the loop when a bearing does come out; and ISO 12944 with ISO 8501-1 govern the protect rung of the ladder.
Why Fluid Reliability Programmes Stall at SMEs
Most UK SME manufacturers have tried pieces of this — a lubricant supplier's sampling scheme, an annual pipework inspection, a filter upgrade after the last failure. The techniques are mature. The programmes stall at the same three points every time:
- The reports arrive as PDFs and stay as PDFs. Oil analysis and inspection results are trending disciplines — the diagnostic power is in sample-over-sample movement — and nobody has time to build the trend curves by hand.
- The data never meets the other data. A rising iron trend is interesting. A rising iron trend on the gearbox where vibration is creeping and bearing temperature is up 4°C is a diagnosis. At most sites those signals live in three systems and are never correlated.
- Interpretation depends on one person. The engineer who knows what copper plus lead means is the same person who knows everything else. When they're busy — or gone — the reports go unread.
None of these are laboratory or materials problems. They're data problems — the same drowning-in-data, starving-for-insight pattern that affects every other operational signal on site.
How AI Ties the Two Halves Together
This is the gap modern AI-powered analytics closes — not by replacing the lab, the inspector or the lubrication engineer, but by doing the unglamorous work that stalls the programme:
- Ingesting lab reports and inspection records automatically — every sample and every wall-thickness reading lands as structured data against the right asset, building trend history without anyone re-keying a PDF.
- Trending against each asset's own baseline — flagging when iron, silicon, viscosity or differential pressure moves abnormally for that machine, not against a generic limit.
- Correlating across signals — fluids, vibration, temperature, pressure and flow in one place, so the combined pattern surfaces as one explained alert instead of three ignored ones.
- Answering in plain English — "which assets show abnormal wear or erosion trends this quarter?" becomes a question anyone on the team can ask, with the supporting evidence cited under the answer.
The specialist knowledge stops living in one head, and the lab and inspection spend you're already committed to finally converts into decisions made while the cheap rungs of the ladder are still available.
Where to Start
1. Rank your fluid systems by pain
Gearboxes on critical lines, hydraulic power packs, slurry and process pipework, key pumps. Use our downtime cost calculator to rank them by what an unplanned stop actually costs — the list is usually shorter than people expect.
2. Fix sampling before anything else
A sample drawn from a drain plug after shutdown tells you about the sludge, not the system. Consistent points, consistent method, machine running and warm. Inconsistent sampling is the number-one source of false alarms — and false alarms kill programmes.
3. Sample and inspect on a cadence that builds a trend
Quarterly oil samples suit most industrial gearboxes and hydraulics; monthly for the truly critical. Pair them with periodic wall-thickness checks on the erosion- and corrosion-prone circuits. The first results are baseline-building — the value compounds from sample three onwards.
4. Get the results out of PDFs and next to your other data
Trend every parameter against the asset's own history, alongside vibration, temperature and work-order records. This is where a platform that understands engineering data earns its keep.
5. Close the loop with the maintenance plan
An abnormal result should trigger a named action — inspect, filter, flush, repair, rebuild-and-protect — with an owner and a re-check date. Fluid data that doesn't change the work plan is just an interesting graph.
Key Takeaways
- Reliability is fluid reliability. A striking share of unplanned downtime traces to fluid systems — lubrication, hydraulics, process flow — and the surfaces they attack.
- The fluid is the earliest witness. Wear metals, contamination and fluid condition move before vibration and long before temperature — and they localise the fault.
- ISO 4406 codes double per step — small drifts in the cleanliness code are big changes in particle load.
- Corrosion, erosion, pitting and abrasion are a repair-and-protect problem — engineered composite repairs and protective coatings routinely beat replacement on cost, lead time and downtime, if the damage is caught while rebuildable.
- Work the ladder: correct the environment → recondition the fluid → repair the component → rebuild and protect the surface → replace last, as a planned event.
- The standards map the terrain — ISO 4406 and 4021 for sampling and cleanliness, ISO 17359 for the programme, ISO 15243 for bearing failure modes, and ISO 12944 with 8501-1 when the answer is protect.
- Programmes stall on data, not chemistry or materials — untrended PDFs, uncorrelated signals, one-person interpretation. AI closes that gap and keeps the cheap options on the table.
- Noria Corporation / Machinery Lubrication. Oil analysis and lubrication management research — component life extension (3–8×) from condition-based oil analysis, and contamination as the dominant cause of hydraulic system failure. machinerylubrication.com
- AMPP (formerly NACE International). IMPACT study — "International Measures of Prevention, Application, and Economics of Corrosion Technologies" (2016): global cost of corrosion estimated at $2.5 trillion/year, with 15–35% avoidable through corrosion management. ampp.org — the $2.5 trillion corrosion crisis (IMPACT study)
- International Organization for Standardization. ISO 4406:2021 — "Hydraulic fluid power — Fluids — Method for coding the level of contamination by solid particles." iso.org — ISO 4406:2021
- SKF Group. Bearing lubrication and damage analysis — lubricant life vs operating temperature, and lubrication-related bearing failure modes. evolution.skf.com — Bearing damage analysis and ISO 15243