
What Predictive Maintenance Actually Is
Predictive maintenance is a maintenance strategy that uses data — usually sensor readings — to forecast when equipment will fail and intervenes before it does. It sits between preventive maintenance (fixed schedules) and prescriptive maintenance (system-recommended actions).
The core idea: instead of fixing things when they break (reactive) or replacing parts on a calendar (preventive), predict failures based on actual condition and act with lead time. The benefits are well documented — according to Deloitte's "Predictive Maintenance and the Smart Factory" research, predictive maintenance typically delivers maintenance cost reductions of 5–10% and uptime improvements of 10–20%. [1]
Why SMEs Have Been Locked Out Until Now
For decades, predictive maintenance was an enterprise-only capability. The reasons were structural:
- Software cost. Traditional condition monitoring platforms cost £50,000+ per year in licensing alone.
- Specialist labour. Vibration analysts, reliability engineers, and data scientists were required to interpret results.
- Sensor infrastructure. Each monitored asset needed dedicated sensors, often hard-wired.
- IT integration. On-premises servers, custom data pipelines, multi-month implementation projects.
That stack made sense for petrochemical refineries and large utilities. It didn't make sense for the 250,000+ manufacturing SMEs in the UK alone, which represent the overwhelming majority of UK manufacturing employment. Three structural changes have flipped the economics:
What's Changed in 2026
1. Cloud-Native Pricing
SaaS platforms with usage-based pricing have replaced on-premises licensing. Annual costs for SME-targeted predictive maintenance platforms built for UK manufacturers typically fall between £3,000 and £30,000 — an order of magnitude lower than enterprise tools.
2. AI-Powered Analysis
Modern AI models analyse sensor data without human specialists. AI anomaly detection learns each asset's normal behaviour and flags deviations automatically. The vibration analyst's role has been augmented, not eliminated — but the entry point for predictive maintenance no longer requires one.
3. Existing Data Is Often Enough
SMEs frequently assume they need to invest in new sensors before predictive maintenance is possible. Modern platforms can ingest data already produced by PLCs, drives, CMMS records, and basic SCADA exports. The data exists — the gap is using it.
The Maintenance Strategy Spectrum
| Strategy | Trigger | Pros | Cons |
|---|---|---|---|
| Reactive | Failure | Low setup cost | Highest total cost; unplanned |
| Preventive | Calendar / hours | Predictable schedule | Over-services healthy assets |
| Condition-based | Threshold alarm | Real condition data | Catches failures late |
| Predictive | AI forecast | Lead time before failure | Requires data + tools |
| Prescriptive | AI recommendation | Action included | Emerging maturity |
Most SMEs sit somewhere between reactive and preventive in 2026. The leap to predictive is the highest-ROI step available to them, and it no longer requires going through every intermediate stage perfectly.
The Asset Failure Modes That Matter Most
Most SME predictive maintenance value comes from monitoring rotating equipment. The fault modes that drive unplanned downtime are well-characterised, the signatures are documented in international standards, and modern AI platforms now recognise them automatically. Here's what to look for on the five fault categories that cover the bulk of SME critical-asset failures.
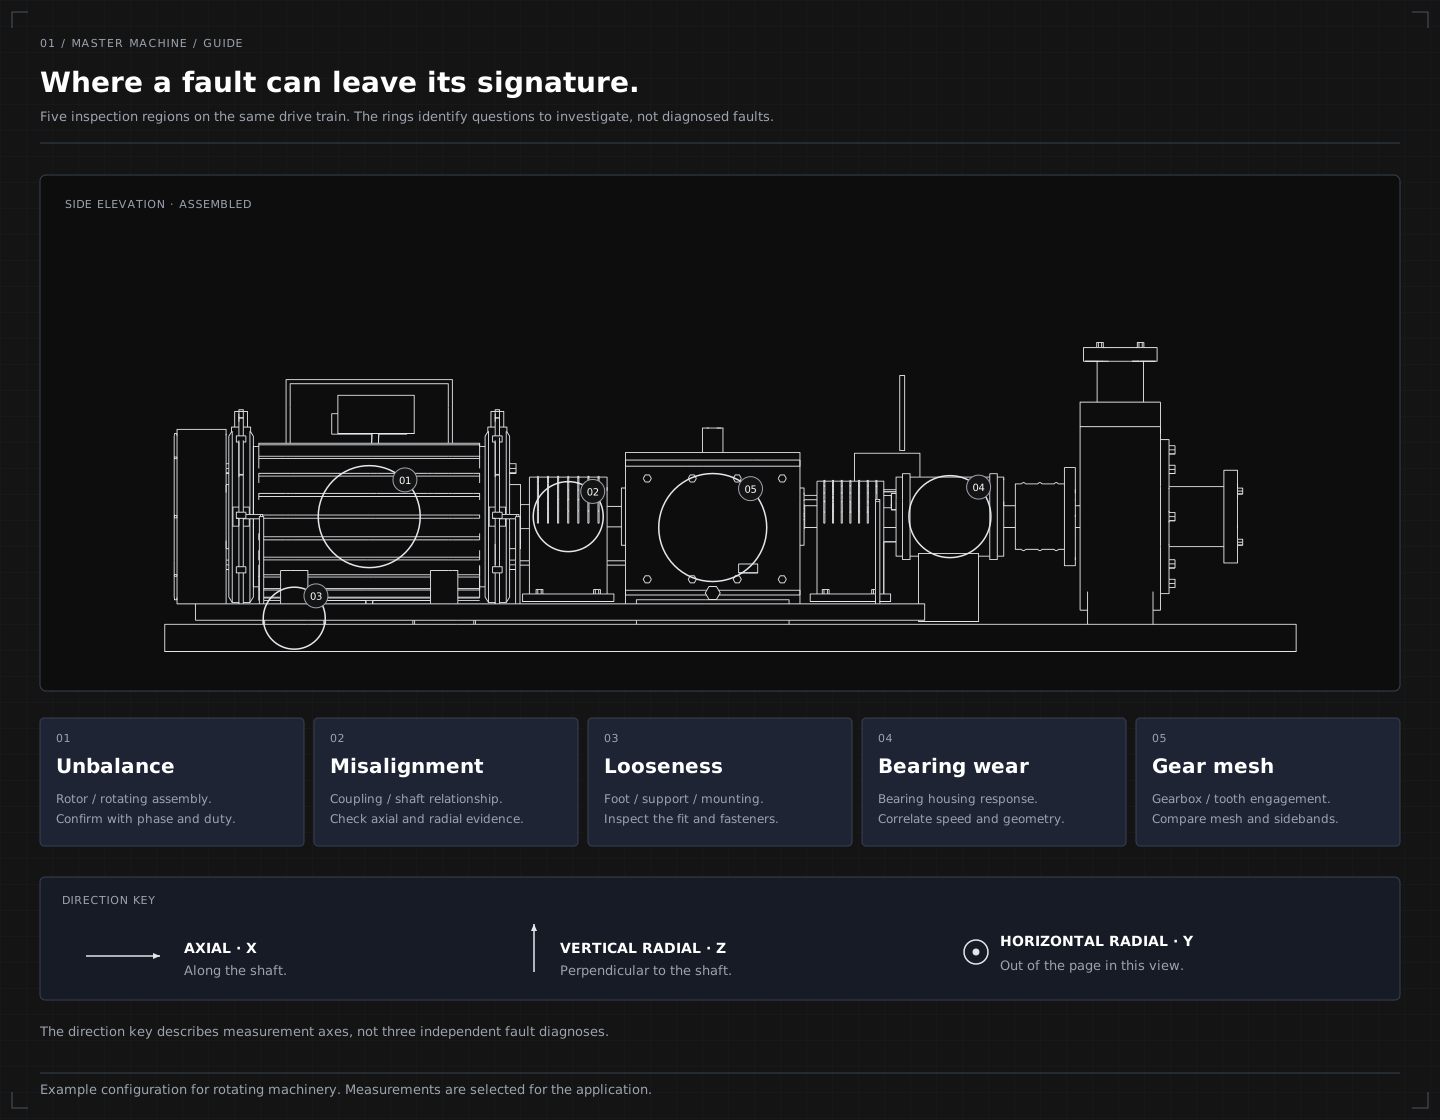
Bearing failure (pumps, motors, gearboxes, fans)
Rolling-element bearings fail in characteristic ways: inner-race defects, outer-race defects, ball or roller damage, and cage damage. Each generates vibration at a specific frequency relative to shaft speed and bearing geometry — the BPFO, BPFI, BSF, and FTF frequencies that vibration analysts have used for decades. Early-stage bearing damage shows up first in high-frequency content (above 10kHz, often called acoustic emission) before it's detectable at standard vibration frequencies. By the time you can hear it or feel it, you have weeks left, not months — the P-F curve explains why.
What to monitor: acceleration (g) on the bearing housing, decomposed into time domain and frequency domain. Look for the characteristic defect frequencies above the noise floor, and watch the trend rather than absolute values.
Misalignment (couplings, gearbox-to-motor connections)
Coupling misalignment generates vibration at twice shaft speed (2x), with a strong axial component. Severe misalignment can also produce 3x and 4x harmonics. Misalignment doesn't usually cause sudden failure on its own — it causes accelerated wear of bearings, seals, and couplings on the surrounding equipment. Catching it early extends the life of those components by months or years.
What to monitor: velocity (mm/s RMS) at both horizontal and axial directions. Strong axial vibration is the giveaway. ISO 10816 / ISO 20816 zones define when it's actionable.
Unbalance (rotating mass)
Unbalance generates synchronous vibration — vibration at exactly 1x shaft speed. Most common causes: material build-up on impellers and fan blades, broken or worn vanes, and missing balance weights. Unbalance is the easiest fault to diagnose and the cheapest to fix (re-balance the rotor), but it's often missed when teams aren't measuring routinely. Left alone, unbalance shortens bearing life dramatically.
What to monitor: velocity at 1x shaft speed. Trend it over weeks. A steadily-rising 1x is usually material build-up; a sudden jump is usually a broken blade or vane.
Mechanical looseness (foundations, bearing housings, structural)
Looseness generates broadband, sub-synchronous vibration with multiple harmonics. It's often confused with bearing damage in early stages. The diagnostic signature is a "comb" of harmonics across the frequency spectrum, with no clean characteristic frequency. Looseness is more common than most teams expect, especially on older plant where foundations and tie-down bolts have loosened over time.
What to monitor: velocity spectrum, looking for half-shaft harmonics (0.5x, 1.5x, 2.5x) which indicate looseness specifically rather than bearing damage.
Lubrication failure (all rotating equipment)
Lubrication failure is the single most preventable cause of bearing failure — and the easiest to monitor with non-vibration data. Lubricant degradation shows up in oil temperature trends, particle counts (if oil analysis is in place), and motor current (additional friction means additional load). Many predictive programmes start here because the data is already available and the corrective action (top up or change the oil) is cheap.
What to monitor: oil temperature, motor current trends, and the high-frequency content of vibration signals (which rises as lubrication degrades).
The point isn't that you need to instrument every asset to catch every failure mode. It's that for any given critical asset, two or three of these failure modes account for most of the historical downtime — and predictive monitoring is essentially the practice of catching them earlier than your existing maintenance routine does.
Data Sources You Already Have
One of the most consistent misconceptions among SMEs evaluating predictive maintenance is that they need to invest in new sensors before they can start. For most use cases, that's not true. The data you already produce — for free, as a by-product of running the equipment — is enough to start. Here are the six sources that almost every UK SME manufacturer already has, and what each contributes.
1. PLC and drive data
Modern PLCs and variable-frequency drives output dozens of internal variables: motor current, speed, torque, temperature, runtime hours, fault codes, output frequencies, harmonic content. Most of this data is sitting in registers that are never read. A modern predictive platform connects via OPC-UA or Modbus and pulls it out continuously. No new hardware, no plant downtime, no engineering change requests required.
2. SCADA historian data
If you have a SCADA system (Wonderware, Ignition, AVEVA, GE iFix, Rockwell FactoryTalk), you have a historian. Historians typically retain process variables — temperatures, pressures, flows, levels — for months or years. This data is gold for condition monitoring because it captures the operational context that determines whether a given vibration reading is normal or abnormal. A pump running hot at low flow is a different story to a pump running hot at design flow.
3. CMMS work order history
Your CMMS contains the failure history that lets the AI learn what failures look like in your specific environment. Even an imperfect CMMS (most are) provides enough labelled examples to bootstrap a useful model. Work orders, failure codes, repair durations, parts consumed, technician notes — all of it tells the AI which sensor patterns matter and which are noise.
4. Quality system data
Out-of-spec quality records often correlate with equipment degradation before vibration or temperature trends move. SPC charts, quality control measurements, scrap records, customer returns — these are signals that something in the process is drifting. A predictive maintenance platform that ignores quality data is missing one of the strongest leading indicators.
5. ERP and finance data
Maintenance budgets, parts inventory, planned-maintenance schedules — these come from the ERP. They're useful for two reasons: they tell the AI what was already planned (so it doesn't generate redundant alerts on scheduled outages) and they tell finance what predictive insights are worth in pounds (lower spare-parts inventory, fewer expedited orders, reduced overtime).
6. Operator notes and tribal knowledge
The unstructured information in operator logs, shift handover notes, and engineering reports often contains the diagnostic detail that structured data doesn't capture. Modern AI platforms with retrieval-augmented generation can read and reason over these documents alongside structured data — a capability traditional BI doesn't have. Don't dismiss the paper logbooks or the OneNote pages. They're often the most valuable source of context the platform will use.
If you have any three of these six sources, you have enough to start. The platform tells you which gaps to fill — and the answer is almost always more historical CMMS data, not more sensors.
What to Monitor First
Don't try to monitor everything. The 80/20 rule applies aggressively in predictive maintenance: a small number of critical assets typically drive most of the unplanned downtime cost.
To prioritise:
- List your critical assets — the ones whose failure stops production or creates safety risk.
- Estimate annual unplanned downtime cost per asset. Hours of downtime × production rate × contribution margin. Use the downtime cost calculator to anchor your numbers.
- Rank by total cost and start with the top 10–20%.
For most SMEs the answer is rotating equipment: pumps, motors, gearboxes, compressors, fans. These tend to have well-understood failure modes — bearing wear, misalignment, cavitation, lubrication breakdown — all of which have documented vibration analysis signatures, good historical data, and high replacement costs.
How to Pilot Predictive Maintenance
The pilot structure that works for SMEs has four characteristics:
- Narrow scope. One critical line, one asset class, one shift — not "all of the factory".
- 3–6 month duration. Long enough to see results, short enough that finance approves quickly.
- Specific success metric. "Reduce unplanned downtime on Line 2 by >5%" beats "improve reliability".
- Defined exit. If the pilot doesn't hit the metric, you walk away. If it does, you scale to remaining lines.
This structure de-risks the project for everyone — finance, operations, and the platform vendor. A complete approach to building the business case is covered here.
The 90-day execution playbook
The four characteristics above describe the right pilot. The week-by-week playbook below is what makes it work.
Days 1–15: Foundation
- Lock the use case. Document the specific asset, the failure mode you're targeting, and the success metric. Get sign-off from operations, finance, and the maintenance lead before any platform work begins.
- Audit the data. List every data source you'll need (PLC, SCADA, CMMS, ERP, quality). Identify the integration approach for each. Flag every gap.
- Pick the vendor. Two or three shortlists, demos on your data not theirs, reference calls with at least one similar-size SME customer. Insist on a concrete answer to: "if we sign next week, what does the system look like on our data in 30 days?"
Days 16–30: Integration
- Connect the data sources. The platform vendor or implementation partner should own this. Watch for time-zone errors, unit-of-measure inconsistencies, and tag-naming chaos in the historian — these always exist on older plant.
- Backfill historical data. The AI needs to learn what "normal" looks like, which means feeding it 6–12 months of historical data minimum. The CMMS history is often the rate-limiting step here.
- Build the alerting workflow. Where do alerts go? Who acts on them? What's the escalation path if the responsible person is off-shift? Document and test before going live.
Days 31–60: Live operation
- Run the platform live. The maintenance team uses it daily. Expect a high false-positive rate in the first two weeks and tune thresholds based on real operational feedback — not vendor defaults.
- Capture the first real catches. The first time the platform predicts a failure that genuinely happens, document it carefully: the alert, the action taken, the cost avoided, the timeline. This is the evidence the business case will live on for the next two years.
- Track the leading KPIs daily. Alerts generated, alerts actioned, true-positive rate, time from alert to action. These tell you whether the platform is being used or quietly ignored.
Days 61–90: Steady state and decision
- Operations team operates the system independently. The implementation partner steps back. If they don't step back voluntarily, you have the wrong partner model.
- Compare results to baseline. Hours of downtime saved, costs avoided, maintenance team feedback, platform usage statistics.
- Decision point. Roll out to additional assets, or pause and reassess. Don't drift into an open-ended extension — the discipline of the hard end-date is what makes the pilot useful in the first place.
The 90-day window is deliberately short. SMEs that let pilots run 6–12 months almost always lose stakeholder attention before producing results. The discipline of a hard end-date forces decisions that an open-ended timeline defers indefinitely.
The ROI Worksheet: Building the Numbers Finance Will Accept
The conversation with finance is won or lost in the spreadsheet. Here's a worksheet that wins approval for SME predictive maintenance programmes, using realistic numbers rather than vendor marketing claims. The same structure works for board-level proposals and for individual line-manager budget requests.
Step 1: Establish baseline downtime cost
Take last year's unplanned downtime hours. For each affected asset or line, calculate the fully-loaded cost:
- Lost contribution margin = downtime hours × revenue per production hour × gross margin percentage
- Idle labour cost = downtime hours × loaded hourly rate × number of operators affected
- Scrap and rework cost = downtime hours × historical scrap cost per hour around stops
- Expedited freight and overtime = annual line item from finance (often forgotten in vendor-built business cases)
Sum these. For a typical SME running £15–30M revenue with 5–8% unplanned downtime, the total usually sits between £150,000 and £800,000 per year. The downtime cost calculator gives you a quick ballpark; the real number from finance gives you the defensible figure for the proposal.
Step 2: Apply realistic improvement assumptions
Industry research from McKinsey, Deloitte, and ARC Advisory consistently shows 30–50% reductions in unplanned downtime from mature predictive programmes, with best-in-class reaching 70–80%. For an SME starting from a low base, model conservatively:
| Year | Reduction assumption | What's happening |
|---|---|---|
| Year 1 | 20% | Pilot scope only, learning curve, threshold tuning |
| Year 2 | 35% | Multi-line coverage, workflows established |
| Year 3 | 45% | Site-wide, mature programme |
These are conservative against the headline industry claims, which gives finance room to be impressed if you exceed them. Conservative projections make exceeded projections look like wins; aggressive projections that come in under target look like failures.
Step 3: Add the secondary benefits
Predictive programmes also deliver:
- Spare-parts inventory reduction — typically 10–20% of carrying cost as predictive lead times let you order on-demand rather than stocking against unknown failures.
- Asset life extension — typically 5–15% extension on critical rotating equipment, deferring capex on replacement.
- Labour productivity — fewer emergency call-outs frees the maintenance team for planned work, reducing overtime by 10–20%.
These are often the difference between a marginal business case and a clear-cut one. Don't omit them — but model them conservatively too.
Step 4: Subtract the costs
- Platform subscription — typically £3,000–£30,000 per year for SME-targeted predictive platforms.
- Implementation and integration — usually 1–3 months of partner engagement, £10,000–£40,000.
- Internal time — the maintenance team needs roughly 2–4 hours per week to work with the platform in the first six months.
Total year-one cost for a typical SME programme: £20,000–£60,000.
Step 5: Run the maths
A typical SME case looks like this:
- Baseline downtime cost: £400,000 per year
- Year 1 reduction (20%): £80,000 in avoided downtime cost
- Secondary benefits (parts, asset life, labour): £30,000
- Total year 1 benefit: £110,000
- Year 1 cost: £40,000
- Year 1 net benefit: £70,000 — payback in approximately 4–5 months
Year 2 benefits roughly double as coverage expands. Year 3 typically triples year 1. That's the conversation finance wants to have, and now you have the spreadsheet to back it up.
KPIs to Track After Go-Live
Once the platform is in operation, four KPIs tell you whether it's actually delivering. Track these monthly from day one and share them with operations and finance.
1. Unplanned downtime hours per critical asset
This is the headline metric. Compare against the baseline you established in the ROI worksheet. Expect noise in the first three months — the team is learning to act on alerts, false positives get tuned out, real positives get caught later than they will at steady state. By month six, the trend should be clearly downward. If it isn't, the platform isn't working in your environment and you need to diagnose why before scaling.
2. Planned vs unplanned maintenance ratio
A reactive operation runs 70–80% unplanned. A mature predictive operation runs 80–90% planned. The shift in this ratio is the leading indicator of programme maturity — and it's often visible before the downtime numbers move dramatically, because catching one failure early shifts an unplanned event into a planned slot without changing the total hours dramatically.
3. Alert true-positive rate
Of the alerts the platform generated, what proportion led to an actual maintenance action that found something real? Target above 60% within six months. Below 40% means the thresholds are too loose and the team will start ignoring alerts within weeks; above 90% means the thresholds are too tight and you're missing degradation. The platform should let you tune this directly, and the tuning is a continuous process as the asset base ages.
4. Time from alert to action
How long does an alert sit in the queue before a maintenance technician investigates? At go-live this might be days. Mature programmes drive it to hours. The KPI matters because the value of the alert decays with time — a bearing alert that sits for two weeks may have moved from "schedule in the next planned maintenance window" to "emergency stoppage" by the time it gets looked at.
These four KPIs, tracked monthly and shared with finance and operations, keep the programme on track. They also pre-empt the inevitable "is this actually working?" question that arrives somewhere around month four, when the early enthusiasm has faded and the real work of operationalising starts.
What Can Go Wrong
Treating It as an IT Project
Predictive maintenance is an operational change, not a software install. The platform is necessary but not sufficient. If maintenance team workflows don't change, the tool sits unused. Build the change management into the rollout from day one.
Buying Hardware Before Software
Some teams start by ordering vibration sensors. Then they have data with nowhere to send it. Always lead with the platform — it tells you what data you actually need.
Over-Engineering the First Month
The temptation is to model every asset perfectly before going live. Resist it. Start with one critical asset, get something useful in week 4, iterate. Perfect is the enemy of good.
Assuming AI Replaces Engineers
AI surfaces patterns. Engineers decide what to do with them. The teams that succeed treat predictive maintenance as a tool for their engineers, not a replacement for them. Skilled tradespeople become more valuable in a predictive operation, not less.
The biggest difference between SMEs that succeed with predictive maintenance and those that don't isn't budget or technical capability — it's whether the maintenance team is brought along as partners from day one, or whether the project is dropped on them.
Building Toward Maturity
A realistic 24-month maturity path for an SME starting from reactive maintenance:
- Months 0–3: Pilot one critical line. Connect existing data. Establish baseline. Prove value.
- Months 3–9: Expand to 3–5 critical lines. Adjust workflows. Train second-line maintenance on platform usage.
- Months 9–18: Expand to whole-site coverage. Integrate predictions into work order systems. Begin tracking MTBF improvements.
- Months 18–24: Optimise. Add prescriptive recommendations. Formalise change management. Share results across organisation.
Most SMEs that follow this path see measurable improvements in unplanned downtime within the first 6 months and have meaningful return on investment within 12. OEE improvements typically follow within the same window.
What "mature" actually means
A mature predictive maintenance programme has five characteristics:
- Coverage — predictions across all critical rotating equipment, not just one line or asset class.
- Closed-loop workflow — predictions automatically generate work orders, and work orders close back to the platform to feed the learning loop.
- Cross-functional ownership — operations, maintenance, engineering, and finance share the dashboards and KPIs. Predictive insight stops being a maintenance-team secret.
- Continuous tuning — alerting thresholds adjust as the asset base ages and operating conditions change. The platform isn't set-and-forget.
- Forward-looking budget — spare-parts and labour budgets reflect predicted-vs-reactive workload, not last year's historical run-rate.
Getting to maturity isn't about technology — by month 12 the technology is solved. It's about workflow change, organisational habit, and management trust in the data. That's why the change management work in early phases matters disproportionately to the technical work, and why pilots that skip stakeholder buy-in almost always stall before reaching maturity.
When to add a partner, and when to step back
Most SMEs benefit from external implementation support during weeks 5–8 of the integration phase, when data quality issues surface and connector edge cases need to be solved. Beyond that window, internal team operation is the right model — both because it builds internal capability and because it keeps ongoing cost in check. Avoid partners who want to be your permanent data team. The right partner makes themselves redundant by month four; the wrong one becomes indispensable by month four and unavoidable thereafter.
Where this fits in the bigger picture
Predictive maintenance is one of several use cases that make up the modern manufacturing analytics stack. For the wider view, see our pillar guide on manufacturing analytics in 2026. If your team is planning AI adoption more broadly than maintenance alone, the SME guide to AI adoption covers the maturity model, build-vs-buy decision, UK funding routes, and a 90-day roadmap that applies across use cases.
Key Takeaways
- Predictive maintenance forecasts failures from data and acts before they happen. It sits between preventive and prescriptive maintenance.
- SMEs were locked out by cost and complexity for decades. Three changes in 2026 have flipped the economics: cloud SaaS pricing, AI-powered analysis, and use of existing data.
- Start with critical assets, not all assets. The 80/20 rule applies aggressively.
- Pilot with narrow scope, 3–6 month duration, specific success metric, defined exit. De-risks everyone.
- Common failures: treating it as IT, buying hardware first, over-engineering the start, sidelining the maintenance team.
- Realistic maturity path: pilot in 3 months, multi-line in 9 months, site-wide in 18 months, optimised in 24.
- Deloitte. "Predictive Maintenance and the Smart Factory" — uptime and maintenance cost impacts. deloitte.com — Predictive Maintenance and the Smart Factory
- Fluke Corporation / Censuswide (2025). UK manufacturer survey on predictive maintenance adoption (12% adoption / 88% not adopted). digit.fyi — Fluke Corporation survey